
Mars Ice Plot
Detailed Description
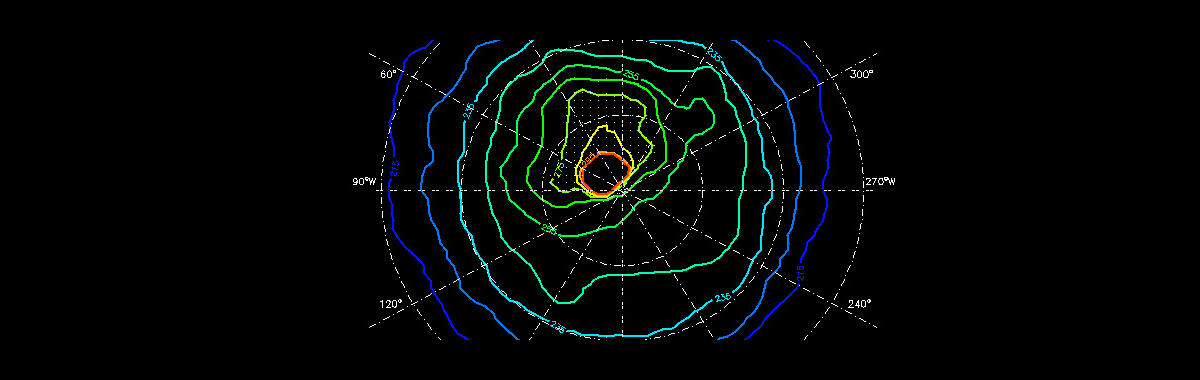
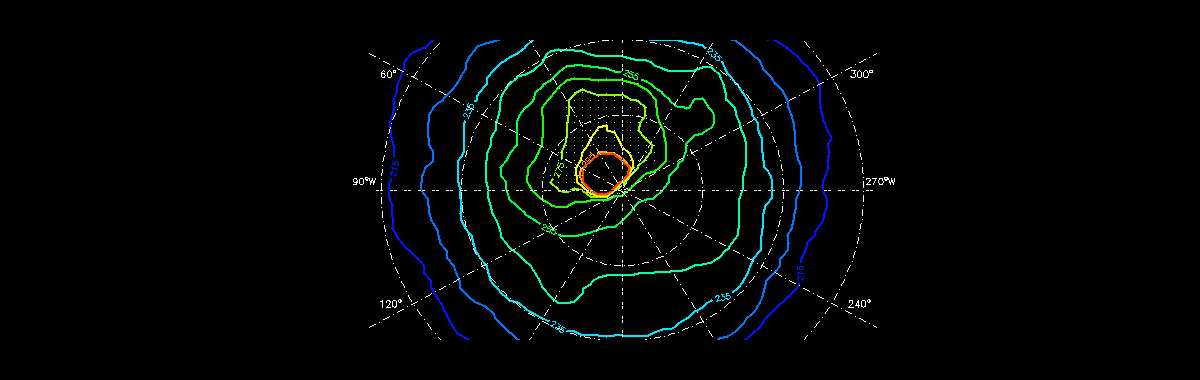
This plot shows the cap edge as a function of season. The data used was 30 µ mpre-mapping TES data. The contour lines are spaced at 10 degrees of Ls, starting with 215 as the dark blue contour.
Sources/Usage
Public Domain.