
Mauna Loa eruption response times over the past 200 years
By Mauna Loa

Detailed Description
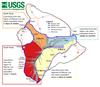
This map shows the response time people can expect based on Mauna Loa eruptions over the past 200 years. Different sectors around Mauna Loa are colored according to how quickly lava flows can reach populated areas. The warmer the color, the more quickly the flows travel. Mauna Loa lava flows over the past 200 years are shown in gray, and the numbers along the coastline indicate lava travel times to the ocean after the vent(s) opened. Large, bold numbers record the average effusion rates for the different parts of the volcano in millions of cubic meters per day (Mm3/d).
Sources/Usage
Public Domain.