
Mid-Atlantic Resource Imaging Experiment Seismic Tracklines 2018
Detailed Description
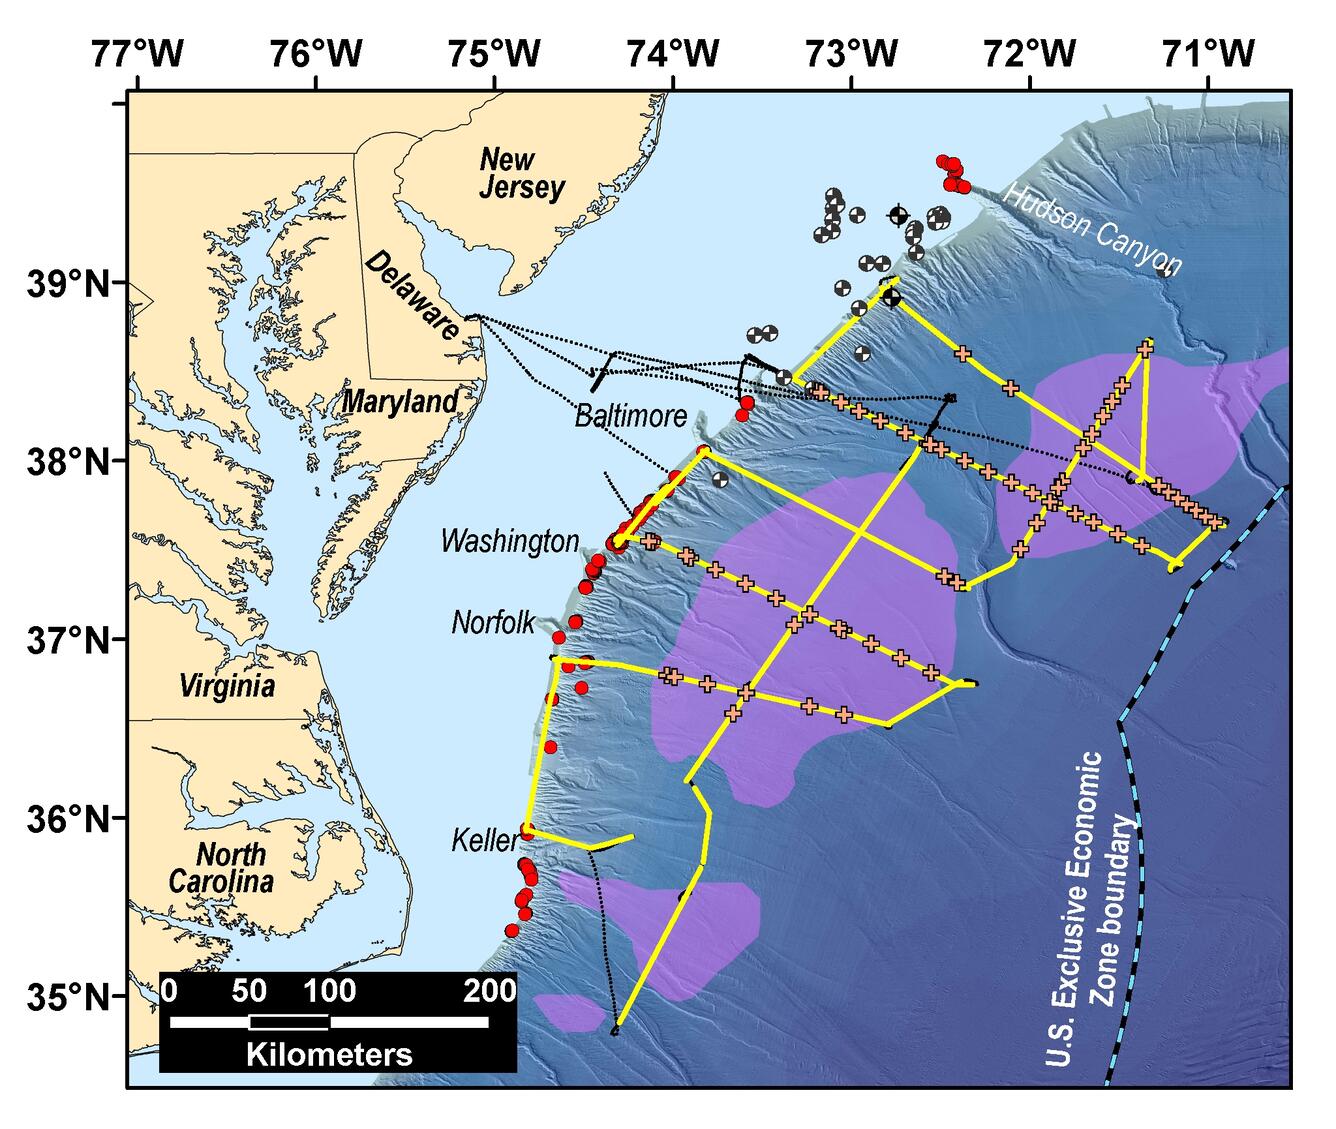
The Mid-Atlantic Resource Imaging Experiment (MATRIX) collected reflection seismic data along more than 2000 km of trackline shown in yellow. Black tracklines show transit lines where no seismic data were acquired, and orange crosses denote sonobuoy deployments. Purple areas were identified by BOEM based on legacy seismic data and show possible gas hydrate accumulations. Red symbols mark seafloor methane seeps, and the black and white circles represent exploratory wells drilled in the 1970s and 1980s. Names at the edge of the shelf refer to the major shelf-break submarine canyons. Bathymetric base map from B. Andrews.
Sources/Usage
Public Domain.