
Monitoring location pages and log scale
Detailed Description
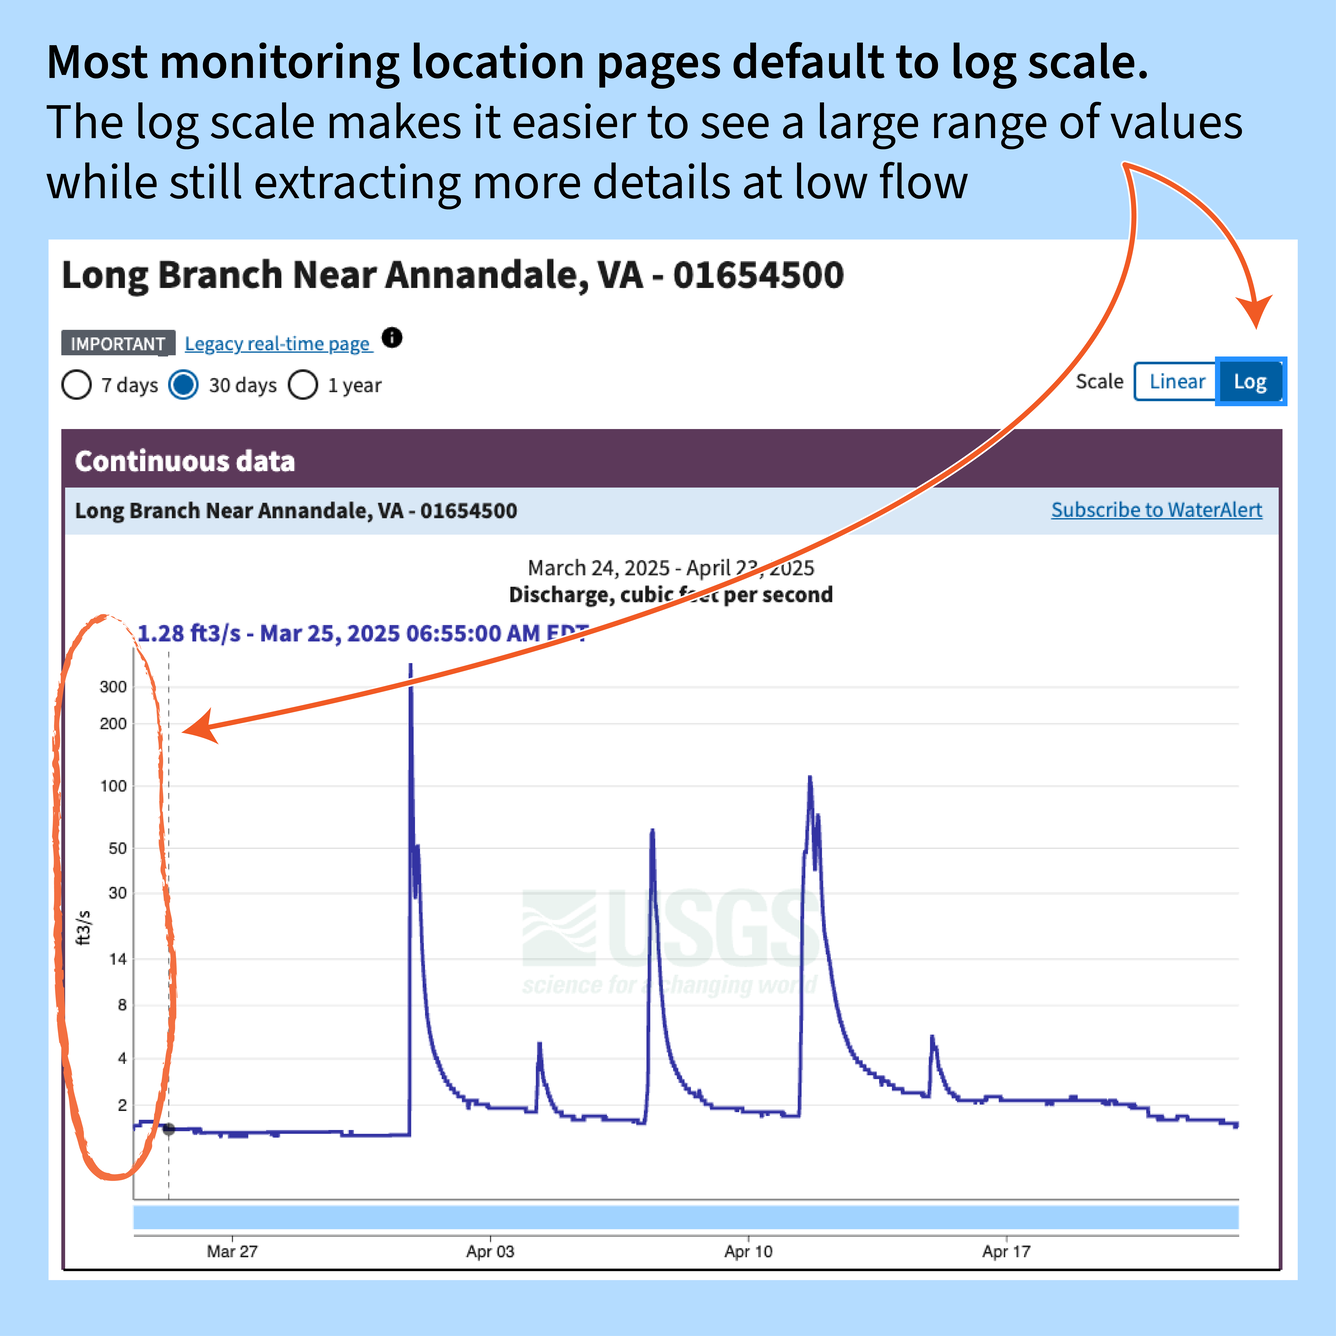
Did you ever wonder why most monitoring location pages default to the log scale?
At many streamgage sites, flow can fluctuate rapidly from day to day. The log scale helps show those peaks while still extracting more details at low flow.
But in tidal environments, like estuaries, log scale doesn’t work as well because as the tide leaves, discharge cycles between positive and negative values. The log scale hides long-term patterns like the two-week cycle from the moon’s phases. These types of sites default to the linear scale.
Timeseries – Log Scale #30DayChartChallenge
Image shows a hydrograph (discharge over time) of a streamgage (Long Branch near Annandale, VA) from March 24 to April 23, 2025. Arrows point to the log-scale button and y-axis showing that discharge is plotted on the log-scale. Peaks as high as 100-300 cubic feet per second are shown, and changes at flow at a smaller scale (less than 4 cubic feet per second) are also shown.
Sources/Usage
Public Domain.