
Northeast region drought streamflow symbology

Detailed Description
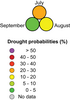
Custom symbology developed for the Northeast Region Drought Streamflow Probabilities web tool. The symbology displays three summer month streamflow drought probabilities for each streamgage in the application (top, July; bottom-left, September; bottom-right August). The top circle (July) corresponds with the location of the physical streamgage and clicking on it displays site-specific streamgage and drought information. Drought probability values are shown using a color coded scale of 7 probability classes and an 8th no-data class.
Sources/Usage
Public Domain.