
Occupancy-abundance relationship of bats populations
Detailed Description
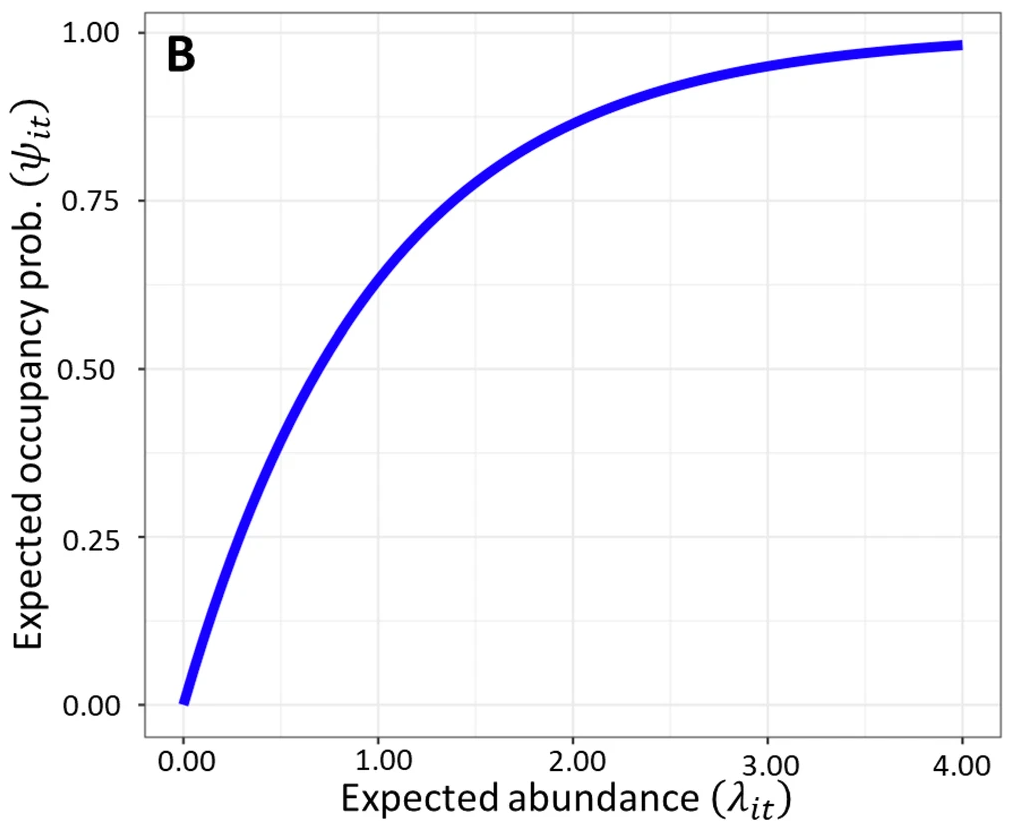
Deterministic relationship between expected abundance and occupancy probability at the grid cell level based on the shared probability of zero.
Monitoring cryptic bat populations is challenging and requires multiple data sources. NABat collects acoustic, capture, and winter colony data and these provide complementary insights into occupancy (where bats are found on the landscape) and abundance (number of individual bats at a specific location).
But traditional analyses treat these data streams separately, leading to inconsistent conclusions related to the impact of WNS: occupancy trends appear relatively stable while abundance declines catastrophically. This mismatch creates confusion for conservation planning and obscures the true population impacts.
Therefore, USGS scientists developed a multi-scale integrated species distribution model that combines all monitoring types, accounts for false positives and negatives, and links seasonal populations through migratory connectivity. Applying this model to 11 years of data for the tricolored bat revealed:
- Abundance declined by ~75%, while occupancy declined by ~35%.
- Declines were spatially asynchronous: abundance dropped most in WNS-affected interiors, but occupancy fell mainly at the edges of the species’ range.
- The connection between how many bats there are and whether they occupy an area is positive but not a straight line. It levels off, meaning occupancy stays high until bat numbers get very close to zero.
- The integrated model reduced uncertainty by up to 86% compared to independent analyses and offers a powerful tool for conservation decisions under emerging disease threats.
The integrated model reduced uncertainty by up to 86% compared to independent analyses and offers a powerful tool for conservation decisions under emerging disease threats.
Sources/Usage
Public Domain.
Related

White-Nose Syndrome and Bat Health: 2025 Year in Review
Related