
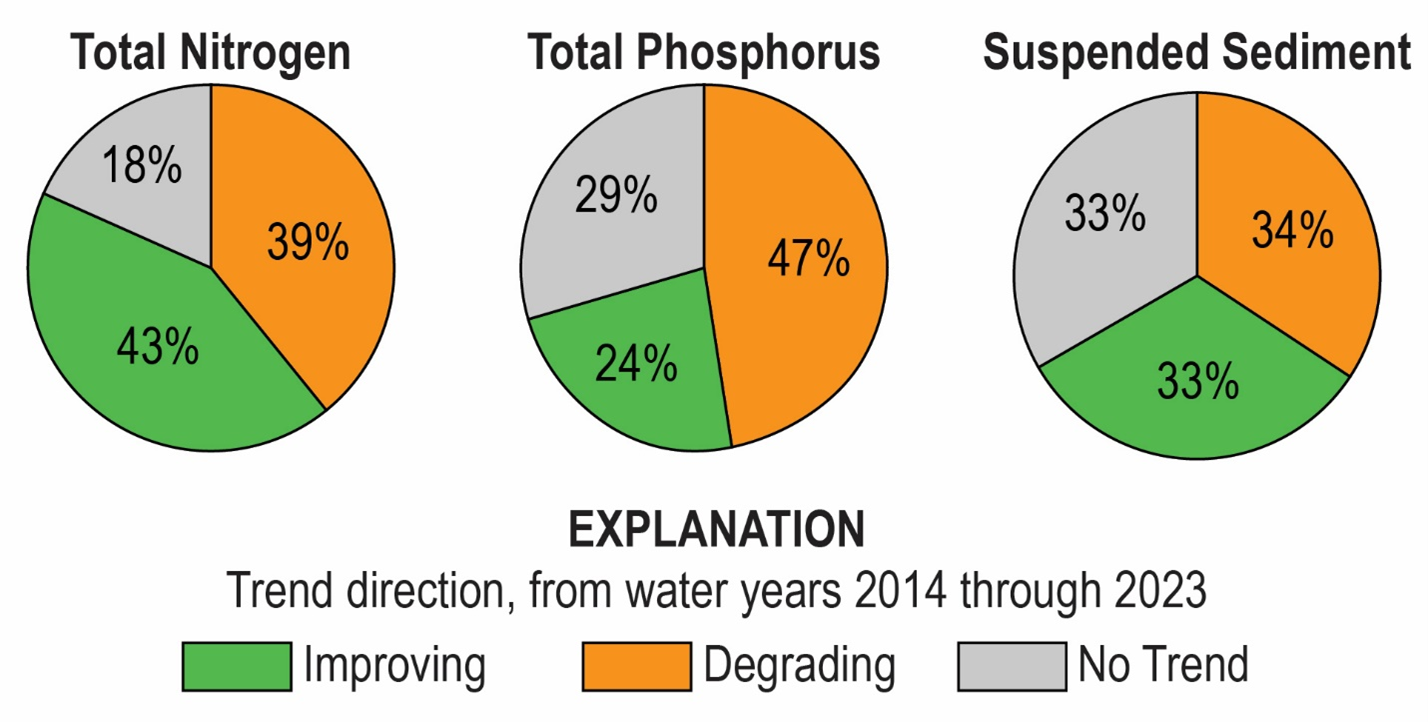
Pie charts showing the percentage of NTN stations with improving, degrading, and no trend in total nitrogen, total phosphorus, and suspended-sediment load from water years 2014 through 2023
By Chesapeake Bay Activities
April 2025 (approx.)

Detailed Description
Pie charts showing the percentage of NTN stations with improving, degrading, and no trend in total nitrogen, total phosphorus, and suspended-sediment load from water years 2014 through 2023.
Sources/Usage
Public Domain.
Related

Informing Chesapeake Bay Watershed Management by Monitoring Trends in River Nutrient and Sediment Loads
The USGS has computed nutrient and suspended-sediment loads and trends through water year 2023 in Chesapeake Bay rivers. These monitoring-based estimates help federal, state, and local managers evaluate and plan water-quality restoration strategies.
Related
Informing Chesapeake Bay Watershed Management by Monitoring Trends in River Nutrient and Sediment Loads
The USGS has computed nutrient and suspended-sediment loads and trends through water year 2023 in Chesapeake Bay rivers. These monitoring-based estimates help federal, state, and local managers evaluate and plan water-quality restoration strategies.