
Plot of earthquakes at Mount Hood since 2010
Detailed Description
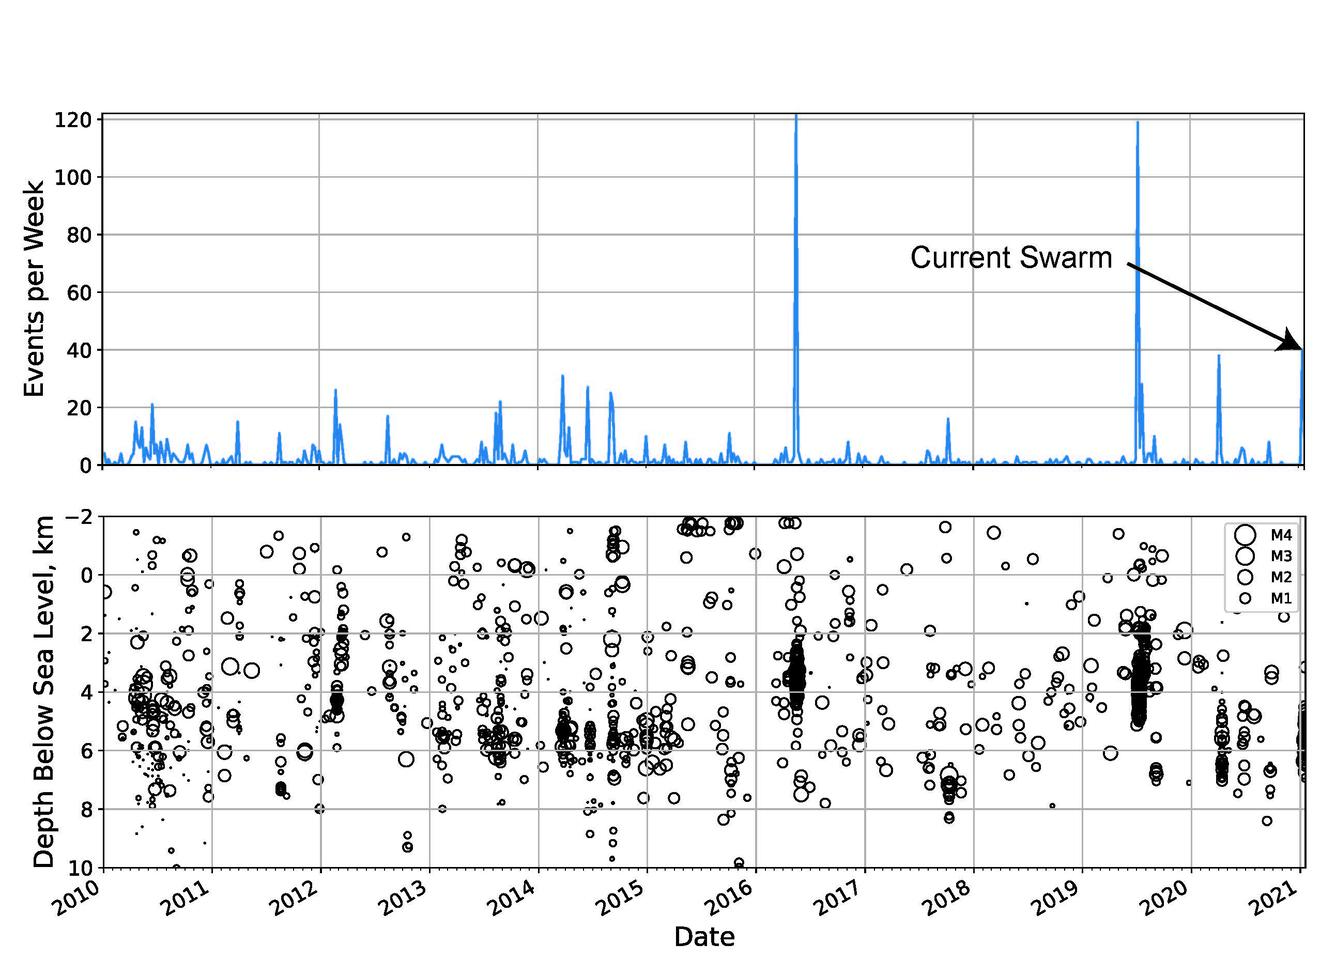
Top: Event rate per week of earthquakes around Mount Hood since 2010. Each spike represents a swarm of earthquakes at the volcano. The current swarm is at the right margin of the plot. Bottom: Depth of earthquakes plotted in time since 2010. The time axis is the same as the top plot.
Sources/Usage
Public Domain.