
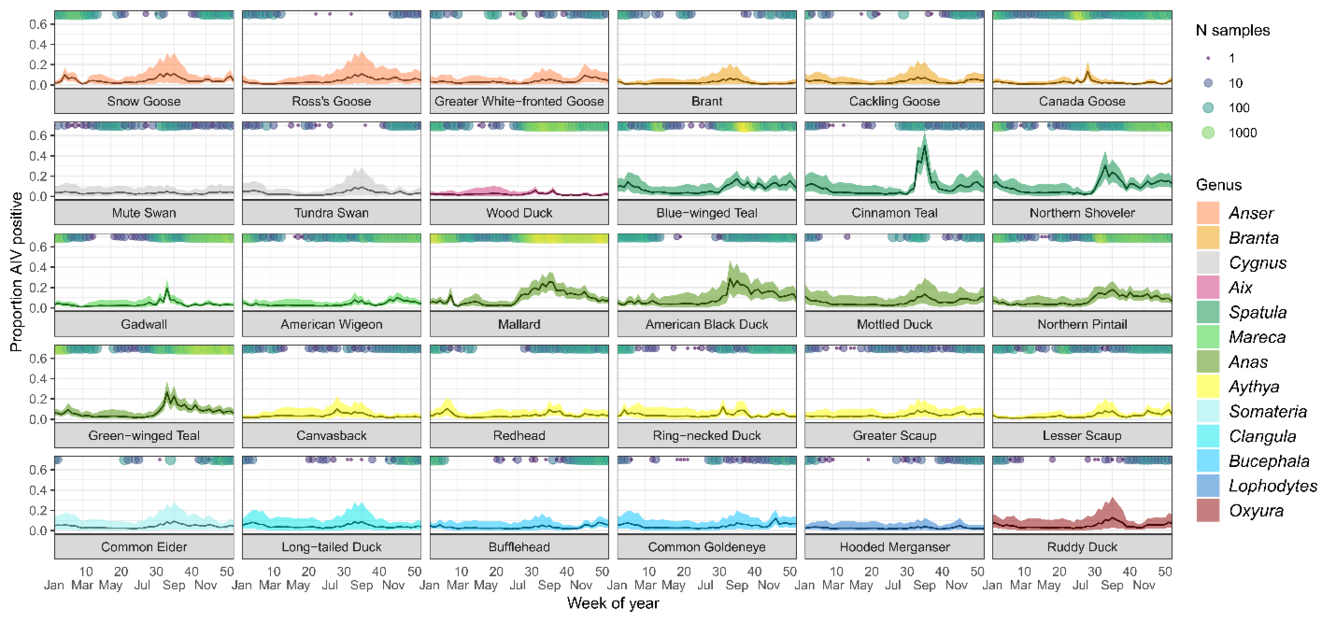
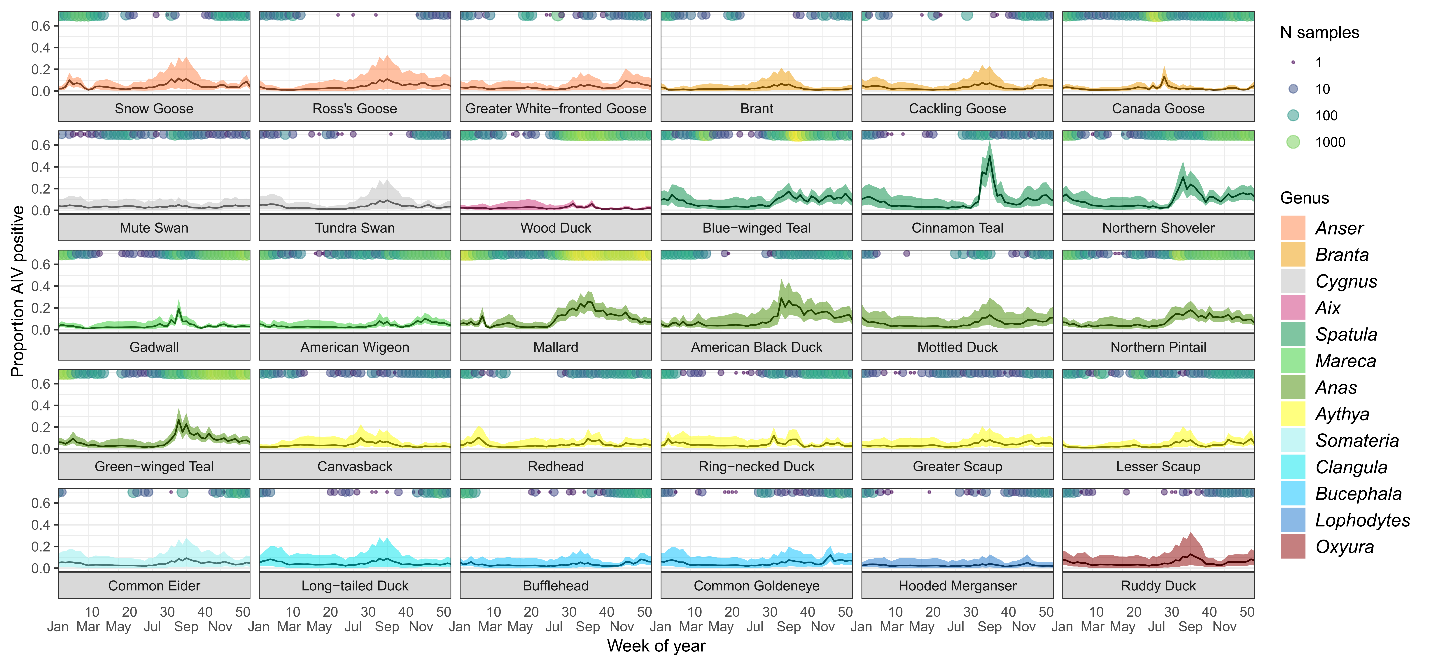
Predicted avian influenza (IAV) prevalence for 30 waterfowl species by week of year
By Eastern Ecological Science Center
2022 (approx.)
Detailed Description
Percentage of individuals predicted to test positive for avian influenza virus (± 95% CI) for each species for each week ignoring spatial effects. Predictions are based on the overall prevalence values in the USDA dataset, which had a higher detection rate. Circles running along the x-axis indicate the number of samples for each species taken during that week. Originally published in Kent et al. (2022, Scientific Reports).
Sources/Usage
Public Domain.
Related
Identifying Spatial and Temporal Trends in Avian Influenza Prevalence in Wild Waterfowl Across the United States
USGS researchers are at the forefront of building and maintaining datasets that represent the spatial and temporal patterns in avian influenza virus prevalence in wild birds, which is critical information used to estimate transmission risk to domestic poultry.