
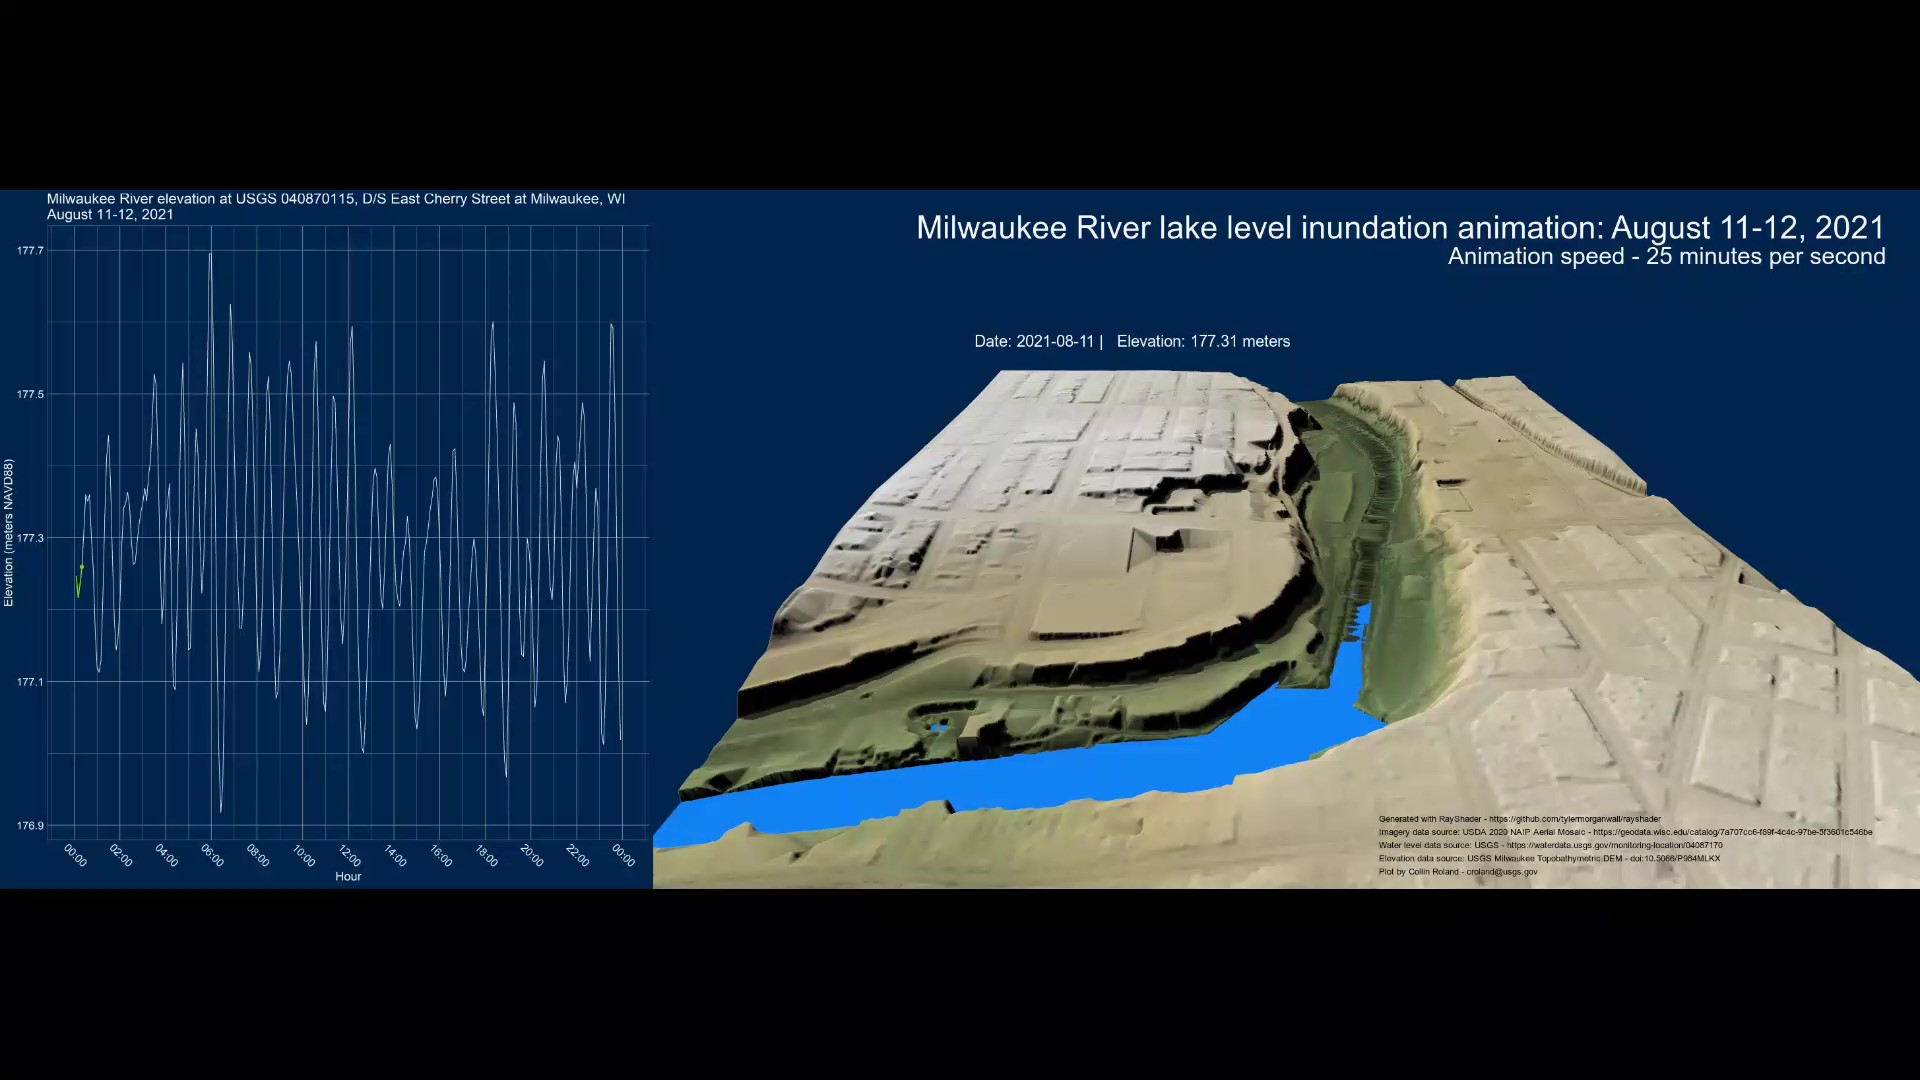
Screenshot of 3-D animation of the upstream impact of lake level fluctuations on the Milwaukee River using water levels recorded at the Milwaukee East Cherry Street gage during the August 11-12, 2021 seiche event

Detailed Description
Screenshot of 3-D animation of the upstream impact of lake level fluctuations on the Milwaukee River using water levels recorded at the Milwaukee East Cherry Street gage during the August 11-12, 2021 seiche event. The maximum amplitude of this seiche approaches 0.4 meters at this location on top of a 177.15 meter lake level elevation. The animation speed represents 25 minutes of time per second of animation.
Sources/Usage
Public Domain.