
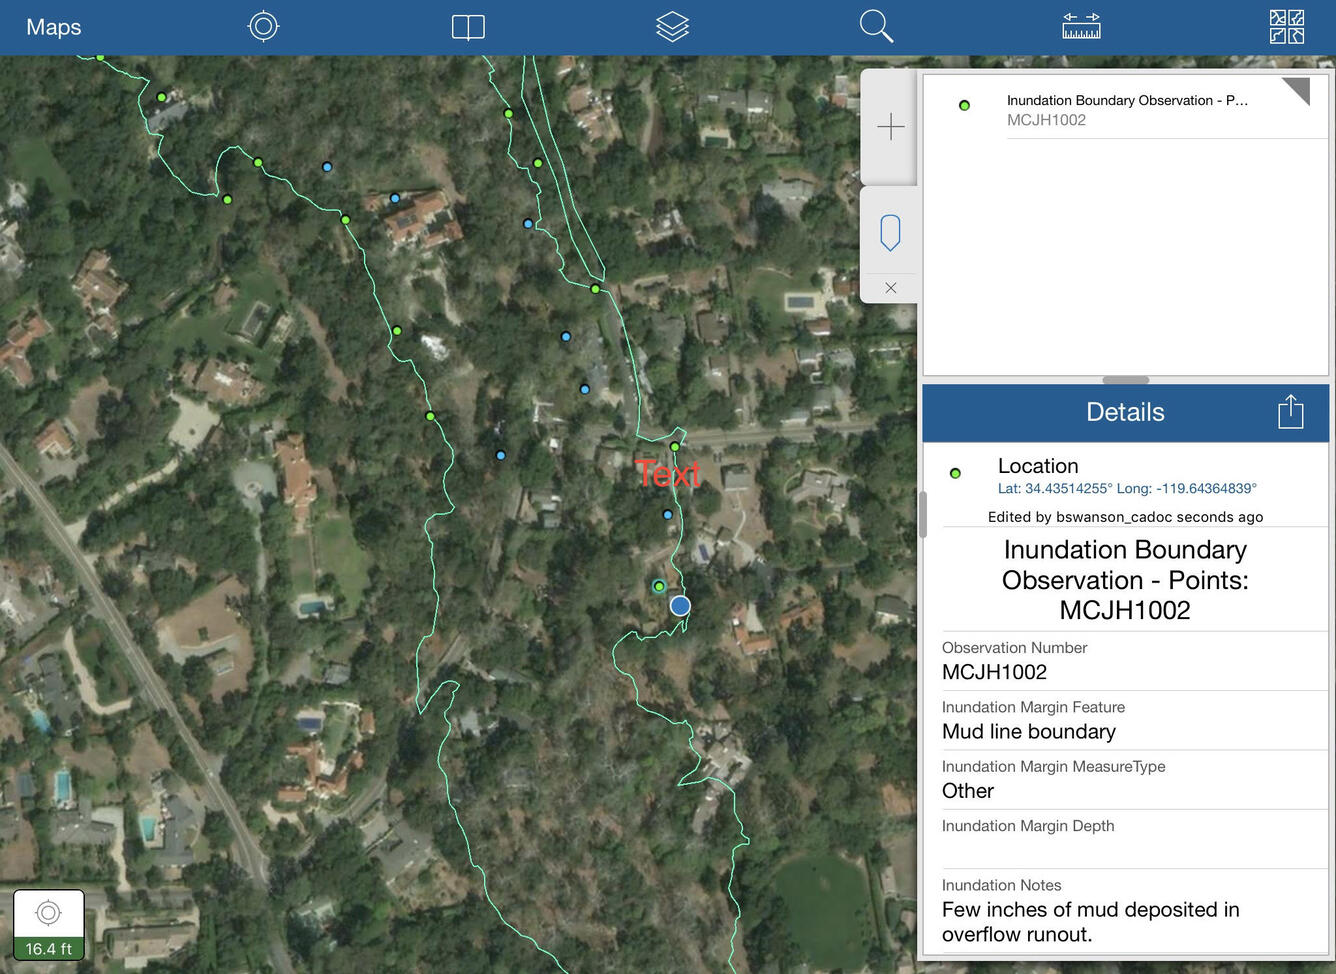
Screenshot of GIS data
Detailed Description
A screenshot example of the geographic information system (GIS) that the geologists used to map the edges of the debris flow to inform officials. The green line represents the estimated inundation; the dots on the map reflect the actual location using GPS pinpoints from the geologists on the ground.
Sources/Usage
Public Domain.