
Simulated representative concentration pathway scenarios, Bay-Delta
Detailed Description
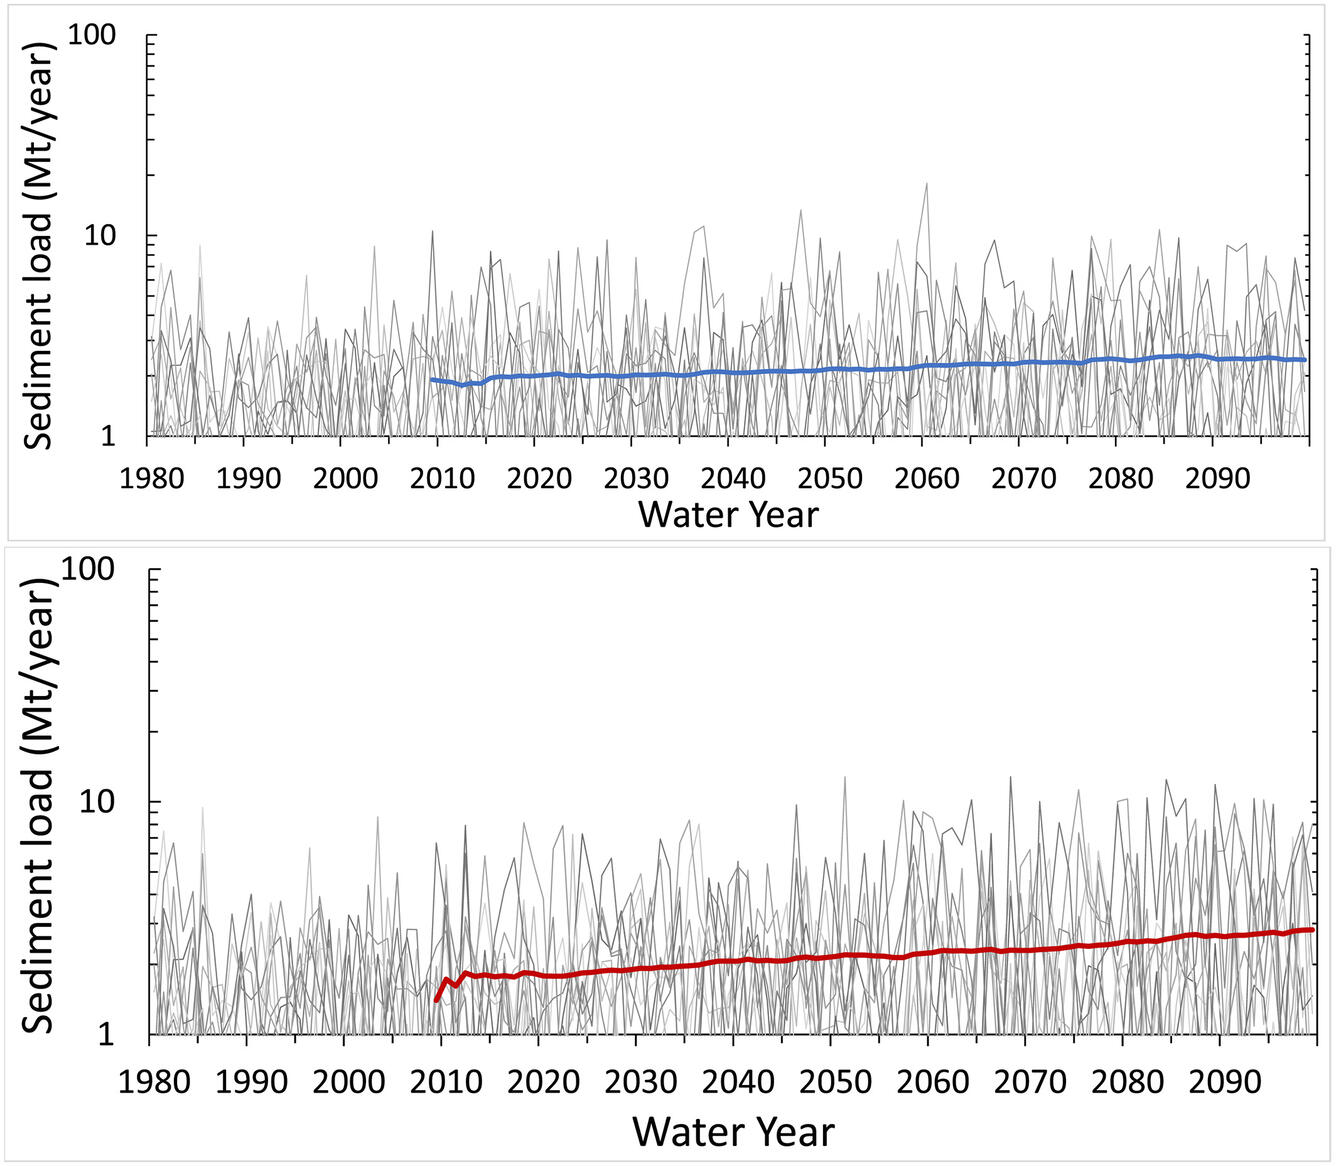
Total annual sediment load (million metric tons, Mt) for the Sacramento River at Freeport location, for representative concentration pathway (RCP) 4.5 scenarios (gray lines) with 30‐year running average for RCP 4.5 ensemble in blue (top panel) and RCP 8.5 scenarios (gray lines) and 30‐year running average for RCP 8.5 ensemble in red (bottom panel).