
From Snow to Flow data viz story (carousel)

Detailed Description
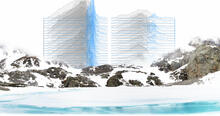
This illustration is part of the From Snow to Flow data visualization story.
A majority of the water in the western U.S. comes from snowmelt, but changes in the timing, magnitude, and duration of snowmelt can alter water availability downstream. This data visualization story explores what changing snowmelt means for water in the West, and how new USGS efforts can advance snow science by modeling snowpack and snowmelt dynamics and linking these results to streamflow.
Sources/Usage
Public Domain.