
Sulfur Dioxide gas emissions from Mount St. Helens

Detailed Description
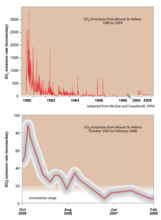
SO2 gas emissions from the 1980 eruption of MSH through to 1988, and at the end of the graph are the October 2004 eruption emissions for comparison. The second graph shows a more detailed view of SO2 gas emissions from October 2005 to February 2008. Gas emissions declined toward the end of the eruption to very low levels that dip into the range of uncertainty. The grey shading surrounding the red line indicates the level of general uncertainty in the measurements.
Sources/Usage
Public Domain.
Adapted from McGee and Casadevall, 1994
Related

Volcanic Gas Monitoring at Mount St. Helens
Gas released from a volcano relates directly to the type, amount, and depth of magma beneath the surface. Scientists measure the types and amounts of different volcanic gases to better understand a volcano's behavior. An increase in gas output or a change in the chemical make up of the gases can be some of the first above-ground signs of an increase in volcanic activity.
Related
Volcanic Gas Monitoring at Mount St. Helens
Gas released from a volcano relates directly to the type, amount, and depth of magma beneath the surface. Scientists measure the types and amounts of different volcanic gases to better understand a volcano's behavior. An increase in gas output or a change in the chemical make up of the gases can be some of the first above-ground signs of an increase in volcanic activity.