
Gas released from a volcano relates directly to the type, amount, and depth of magma beneath the surface. Scientists measure the types and amounts of different volcanic gases to better understand a volcano's behavior. An increase in gas output or a change in the chemical make up of the gases can be some of the first above-ground signs of an increase in volcanic activity.
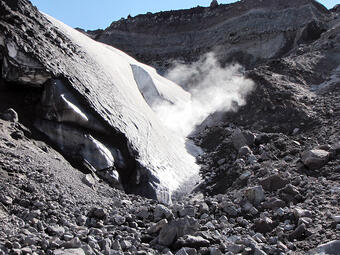
Since gas emissions studies began at Mount St. Helens in 1980, essentially all techniques to collect samples have been used: direct measurement of fumaroles on the ground, airborne measurements of eruption plumes, and analysis of water chemistry for gas contents.
Like most volcanoes, the majority of gas emitted at Mount St. Helens is water vapor (H2O), followed next by carbon dioxide (CO2), and sulfur gases, including sulfur dioxide (SO2) and hydrogen sulfide (H2S). Measuring and analyzing water vapor released by the magma can be useful to determine how much heat is present. Carbon dioxide is very important to monitor because it comes out of magma at deeper than other volcanic gases, and when increased levels are measured at the surface it may mean that new magma is entering the system from below. Sulfur dioxide and hydrogen sulfide are the two most abundant sulfur bearing gas types (species) at Mount St. Helens. The amount of each species in a gas sample reflects the state of volcanic activity; greater H2S is typically a signal of quiet times when groundwater filters out much of the sulfur gases that rise from the magma, and greater SO2 typically occurs during periods when there is either an increase in the amount of magma or when magma is closer to the surface, both of which can be a sign of potential eruptive activity.
Between 1980 and 1988 there was an unparalleled focus on collecting repeated measurements of volcanic gas emissions at Mount St. Helens. Once eruptive activity died down, interest shifted away from the volcano, but was renewed in 2004 when a seismic swarm beneath the volcano indicated that it was reawakening. The 2004 increase in activity was accompanied by low gas emissions until approximately one week after the eruption began, though no continuous on-the- ground monitoring was in place at the time.
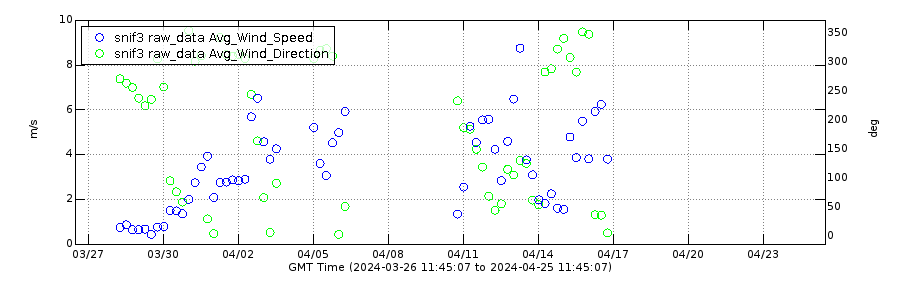
Following the 2004-2008 eruption, a long-term goal at Mount St. Helens was to install real-time gas monitoring to detect changes and subtle signs of activity more rapidly. In 2014, a 'multi-GAS' monitoring station named SNIF was installed on the 2004-2008 lava dome to continuously monitor carbon dioxide (CO2), sulfur dioxide (SO2), and hydrogen sulfide (H2S) levels, along with other parameters like wind speed and direction and the temperature of nearby gas vents (fumaroles), in the crater. Real-time data from the SNIF station are below and also available on the Mount St. Helens webpage.

1980-1988
The 1980-1986 eruption of Mount St. Helens remains one of the most extensively monitored eruptive periods for gas emission at any volcano worldwide. Between May 1980 and the end of 1986, 800 airborne measurements of SO2 were taken, and over a 1000 measurements occurred by the end of 1988. This extensive study showed that SO2 dropped steeply after the May 18, 1980 eruption – thought to be the result of a decreased magma supply to the surface. Increased rates of SO2measured before several dome extrusions were signs that magma was moving at a more rapid rate toward the crater vent – the heightened SO2emissions continued until periods of dome extrusion stopped.
CO2 emissions were also monitored quite well in the first two years of the eruption with nearly 120 measurements between July 1980 and August 1981. The data show a similar sharp decline in the amount of CO2emitted over that time period with peak emissions over 22 kilotons per day.
2004-2008
Between 2004 and 2008, airborne surveys of gas emissions recorded CO2, SO2, and H2S. CO2 and SO2 emissions rates were distinctly lower than those of the very early 1980's, but similar to the lava- dome eruptions that occurred later in the 1980's period of activity. The magma that drove the eruption of 2004 – 2008 was described as "flat," meaning that the amount of gas in the magma was less than what was measured in the early 1980's. Therefore, it is believed that little new "gas-rich" magma entered the Mount St. Helens system in the months before the 2004 eruption began.
By measuring the varieties and quantities of gas emissions at Mount St. Helens and combining that information with other monitoring data, scientists are better able to provide eruption warnings and understand how the volcano works.
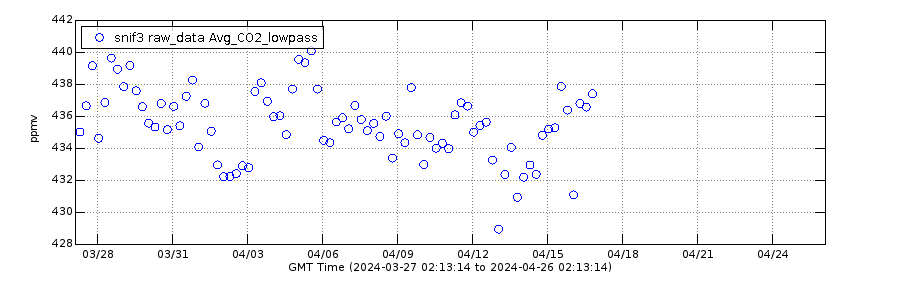
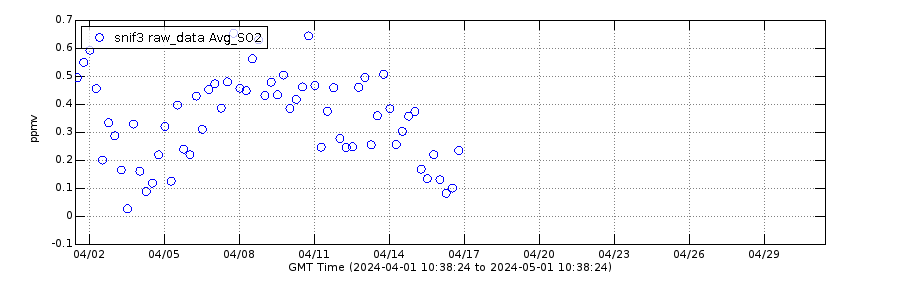
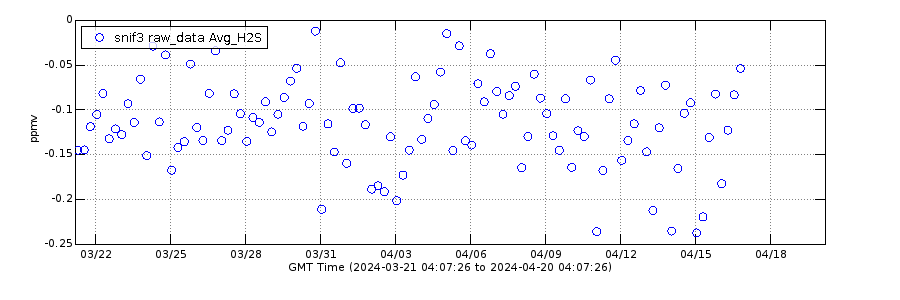
Real Time Volcanic Gas Data for Mount St. Helens
Real-time monitoring data have not been quality-checked by an analyst and should be considered preliminary. Apparent variations in indicated values may appear due to automated diagnostics, periodic maintenance, or sensor failures. Telemetry problems, sensor malfunctions, or other issues may take some time to address due to the remote nature of the site.

Gas released from a volcano relates directly to the type, amount, and depth of magma beneath the surface. Scientists measure the types and amounts of different volcanic gases to better understand a volcano's behavior. An increase in gas output or a change in the chemical make up of the gases can be some of the first above-ground signs of an increase in volcanic activity.
Since gas emissions studies began at Mount St. Helens in 1980, essentially all techniques to collect samples have been used: direct measurement of fumaroles on the ground, airborne measurements of eruption plumes, and analysis of water chemistry for gas contents.
Like most volcanoes, the majority of gas emitted at Mount St. Helens is water vapor (H2O), followed next by carbon dioxide (CO2), and sulfur gases, including sulfur dioxide (SO2) and hydrogen sulfide (H2S). Measuring and analyzing water vapor released by the magma can be useful to determine how much heat is present. Carbon dioxide is very important to monitor because it comes out of magma at deeper than other volcanic gases, and when increased levels are measured at the surface it may mean that new magma is entering the system from below. Sulfur dioxide and hydrogen sulfide are the two most abundant sulfur bearing gas types (species) at Mount St. Helens. The amount of each species in a gas sample reflects the state of volcanic activity; greater H2S is typically a signal of quiet times when groundwater filters out much of the sulfur gases that rise from the magma, and greater SO2 typically occurs during periods when there is either an increase in the amount of magma or when magma is closer to the surface, both of which can be a sign of potential eruptive activity.
Between 1980 and 1988 there was an unparalleled focus on collecting repeated measurements of volcanic gas emissions at Mount St. Helens. Once eruptive activity died down, interest shifted away from the volcano, but was renewed in 2004 when a seismic swarm beneath the volcano indicated that it was reawakening. The 2004 increase in activity was accompanied by low gas emissions until approximately one week after the eruption began, though no continuous on-the- ground monitoring was in place at the time.
Following the 2004-2008 eruption, a long-term goal at Mount St. Helens was to install real-time gas monitoring to detect changes and subtle signs of activity more rapidly. In 2014, a 'multi-GAS' monitoring station named SNIF was installed on the 2004-2008 lava dome to continuously monitor carbon dioxide (CO2), sulfur dioxide (SO2), and hydrogen sulfide (H2S) levels, along with other parameters like wind speed and direction and the temperature of nearby gas vents (fumaroles), in the crater. Real-time data from the SNIF station are below and also available on the Mount St. Helens webpage.
1980-1988
The 1980-1986 eruption of Mount St. Helens remains one of the most extensively monitored eruptive periods for gas emission at any volcano worldwide. Between May 1980 and the end of 1986, 800 airborne measurements of SO2 were taken, and over a 1000 measurements occurred by the end of 1988. This extensive study showed that SO2 dropped steeply after the May 18, 1980 eruption – thought to be the result of a decreased magma supply to the surface. Increased rates of SO2measured before several dome extrusions were signs that magma was moving at a more rapid rate toward the crater vent – the heightened SO2emissions continued until periods of dome extrusion stopped.
CO2 emissions were also monitored quite well in the first two years of the eruption with nearly 120 measurements between July 1980 and August 1981. The data show a similar sharp decline in the amount of CO2emitted over that time period with peak emissions over 22 kilotons per day.
2004-2008
Between 2004 and 2008, airborne surveys of gas emissions recorded CO2, SO2, and H2S. CO2 and SO2 emissions rates were distinctly lower than those of the very early 1980's, but similar to the lava- dome eruptions that occurred later in the 1980's period of activity. The magma that drove the eruption of 2004 – 2008 was described as "flat," meaning that the amount of gas in the magma was less than what was measured in the early 1980's. Therefore, it is believed that little new "gas-rich" magma entered the Mount St. Helens system in the months before the 2004 eruption began.
By measuring the varieties and quantities of gas emissions at Mount St. Helens and combining that information with other monitoring data, scientists are better able to provide eruption warnings and understand how the volcano works.
Real Time Volcanic Gas Data for Mount St. Helens
Real-time monitoring data have not been quality-checked by an analyst and should be considered preliminary. Apparent variations in indicated values may appear due to automated diagnostics, periodic maintenance, or sensor failures. Telemetry problems, sensor malfunctions, or other issues may take some time to address due to the remote nature of the site.