Thumbnail for Figure 1, Horn, et al. (2018)

Detailed Description
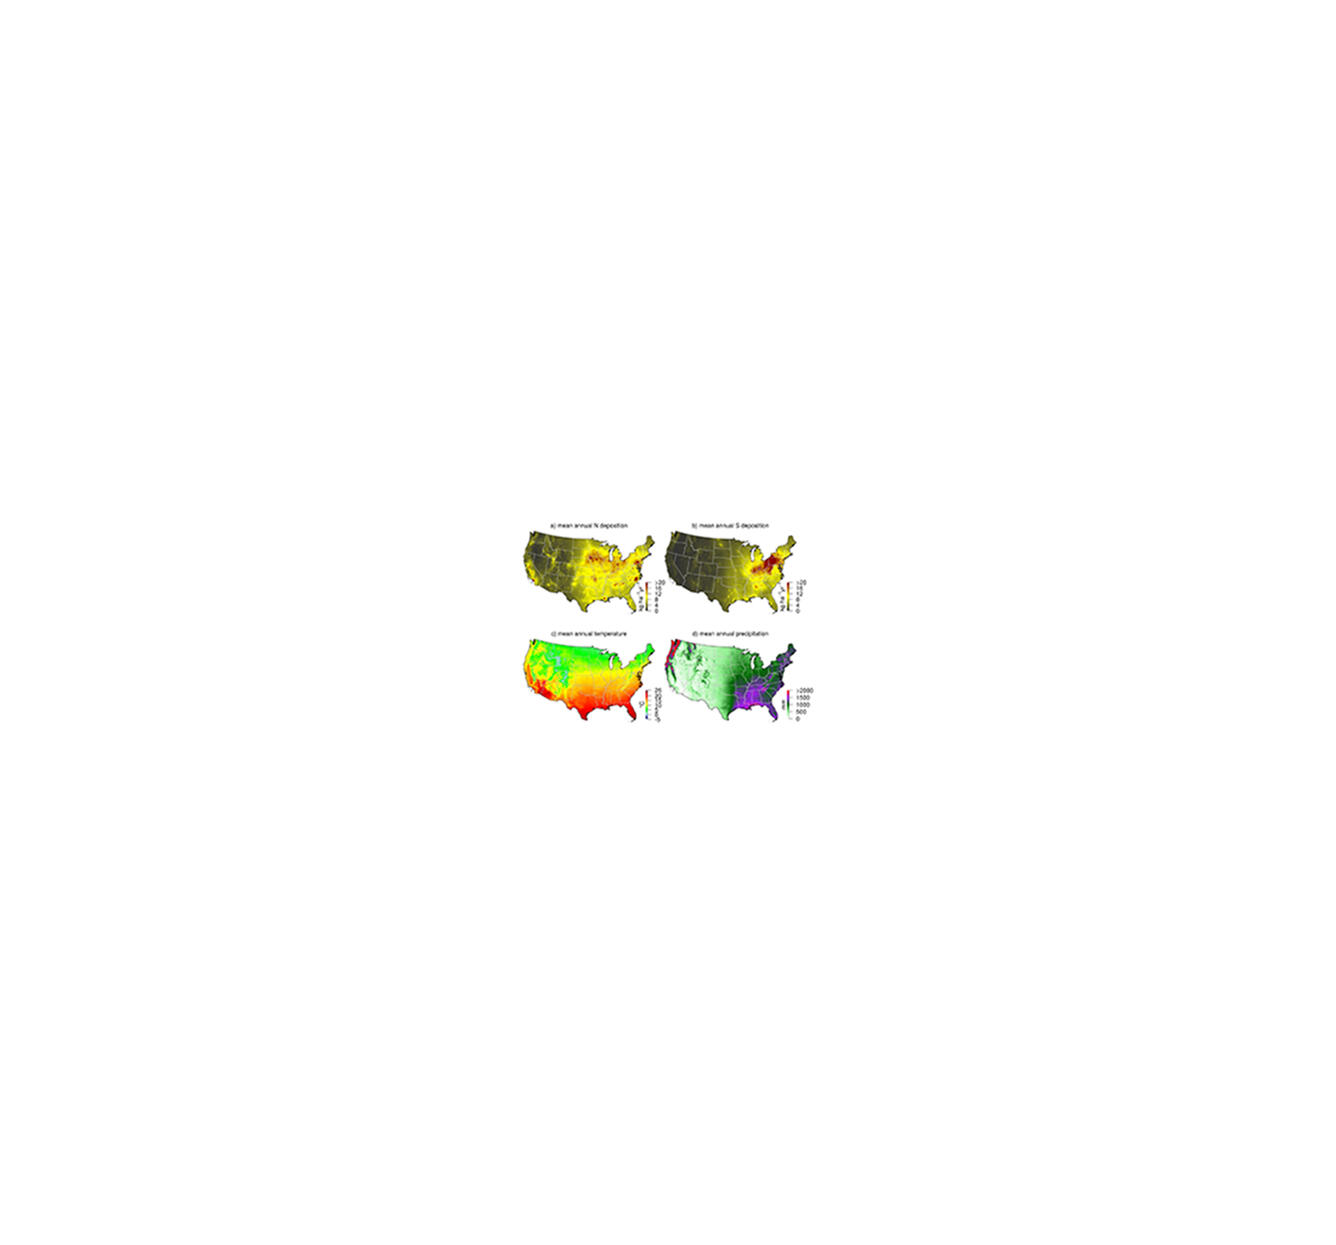
Gradients of N deposition, S deposition, mean annual temperature, and mean annual precipitation across the conterminous U.S. Panels are the a) mean total N deposition from 2000–2012, b) mean total S deposition from 2000–2012, c) mean annual temperature from 2000–2014, and d) mean annual precipitation form 2000–2014. Deposition data are from the TDEP product [23] and climate data are from PRISM (http://prism.oregonstate.edu). The averages for each tree in the analysis were a subset of these datasets that coincided with its measurement interval. The values used in the species-level empirical models correspond to the spatial distribution of the species.
Sources/Usage
Public Domain.
Horn KJ, Thomas RQ, Clark CM, Pardo LH, Fenn ME, Lawrence GB, et al. (2018) Growth and survival relationships of 71 tree species with nitrogen and sulfur deposition across the conterminous U.S. PLoS ONE 13(10): e0205296. https://doi.org/10.1371/journal.pone.0205296

