
USGS Stage-Discharge Relation Example
Detailed Description
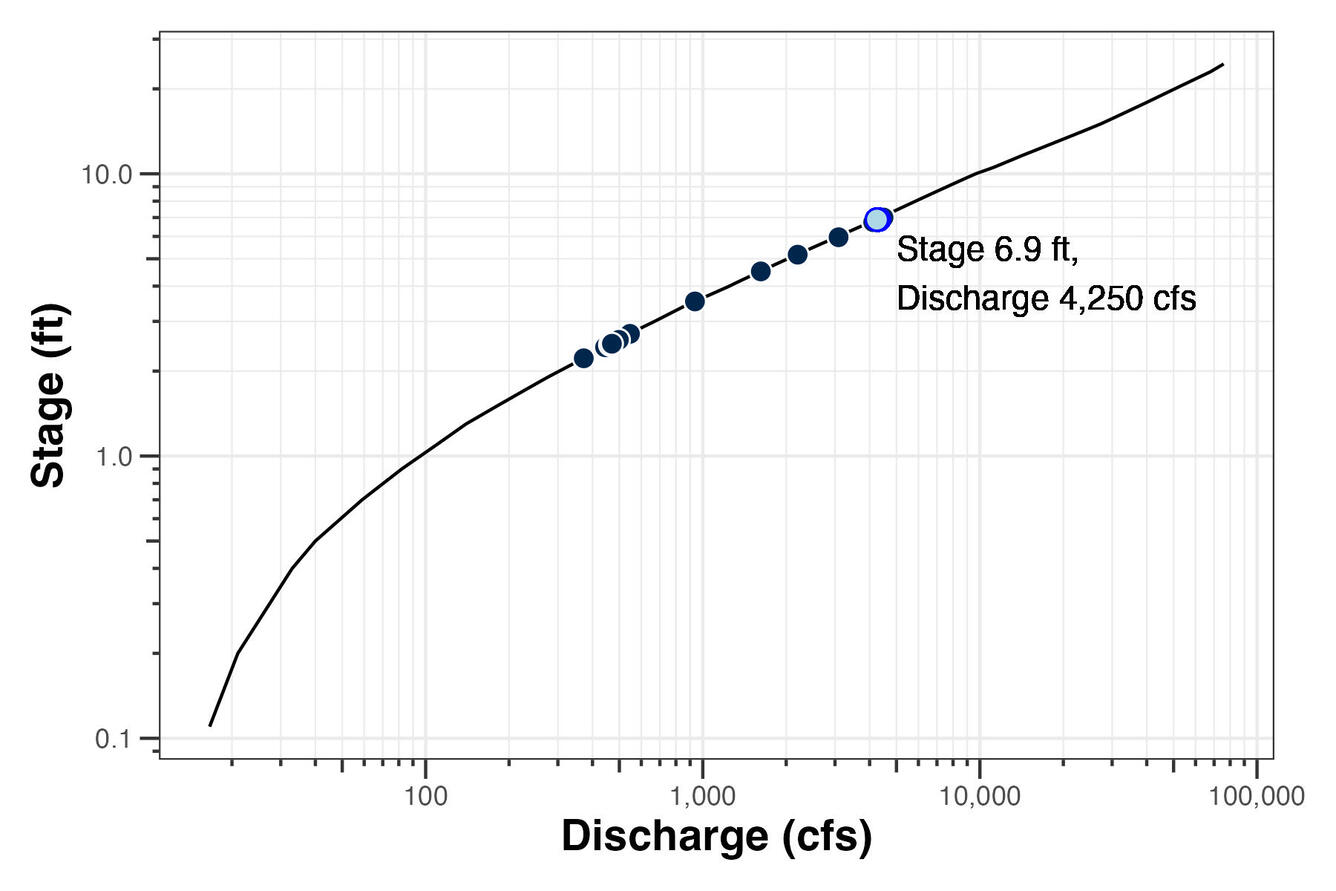
USGS Stage-Discharge Relation Example.
The continuous record of stage is converted to streamflow by applying a mathematical rating curve. A rating curve is a graphic representation of the relation between stage and streamflow for a given river or stream. USGS computers use these site-specific rating curves to convert the water-level data into information about the flow of the river.
The rating curve is developed from a number of physical discharge measurements collected over a period of time and over a range of stages (from low flow to flood stage). Each point on the graph represents one discharge measurement (here, between May 2025 and May 2026). Streamflow is measured in cubic feet per second (cos), which is equivalent to a box of water measuring 1 by 1 foot with a flow rate of about 7.5 gallons per second.
The stage-discharge relation depends on the shape, size, slope, and roughness of the channel at each gage and is different for every streamgage. A rating curve often changes after a flood when the physical force of high water movement can change the dimensions of the streambed or stream channel. To keep the rating curve accurate and up-to-date, USGS hydrologic technicians visit each streamgage about once every 6 weeks to measure the flow directly and also measure high flows when they happen.
These data and the rating curve are from Monitoring Location USGS-01205500, May 2025 through May 2025. The rating curve can be downloaded from https://api.waterdata.usgs.gov/stac-files/ratings/USGS.01205500.exsa.rdb. Learn more about API services for rating curves.
Sources/Usage
Public Domain.
Related

Water Q&A: Does stage tell you how much water is flowing?

Streamgaging Basics

How Streamflow is Measured
Related
Water Q&A: Does stage tell you how much water is flowing?
Streamgaging Basics