
Volcanic explosion penetrates both upper atmosphere and upper crust around the globe
Slightly more than one year ago, a rare, enormous volcanic explosion created pressure waves in the atmosphere that pushed on the top 3.1 miles/5 kilometers of the Earth, giving scientists a clear “x-ray” of a depth range of the crust that is rarely in focus.
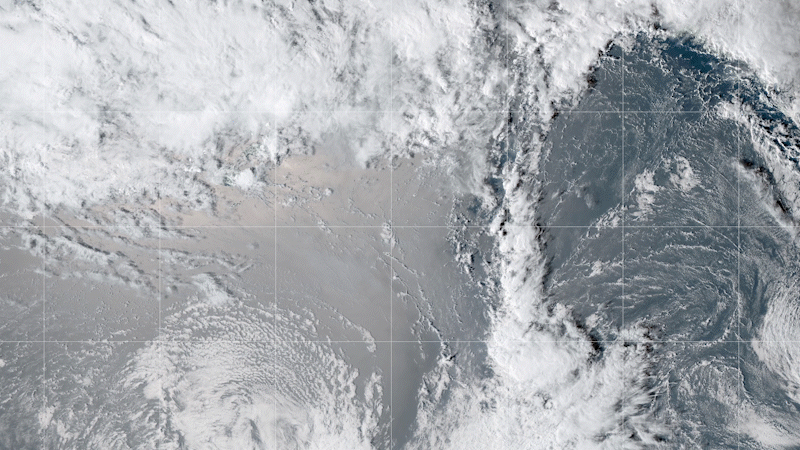
On January 15, 2022, the Hunga Tonga-Hunga Ha’apai (HTHH) volcano, 44 miles/70 kilometers south of the Tongan capital of Nuku’alofa, began erupting with a violent explosion. The eruption, one of the largest in the past century, pushed a plume of volcanic ash higher in the atmosphere than ever recorded, about 35 miles/56 kilometers into the sky. In addition to the ash plume, the eruption triggered a tsunami that reached the surrounding islands, which are largely uninhabited. Six fatalities were reported following the tsunami.
At the same time, another phenomenon caused by the explosion was pushing on the Earth’s crust as it travelled around the globe at the speed of sound. This silent reverberation of pressure waves (they can’t be called “sound waves” because they are at frequencies too low for humans to hear) had wavelengths of tens of kilometers (think of the distance between downtown Los Angeles and Long Beach, CA) and lasted several days. As they bounced around the Earth’s lower atmosphere, their large wavelengths pushed down on the ground surface, actually deflecting the ground about the width of a strand of spider web as they passed but penetrating down to around 3.1 miles/5 kilometers. Although undetectable to humans, the pressure waves and ground movements were recorded by microbarograph sensors and seismometers all around the world.

Pressure sensors at seismic stations are most often used to collect “pressure noise” caused by wind and small explosions (such as those at rock quarries) that can then be removed from the seismic recordings of earthquakes. Although earthquakes that occur in populated areas are a geological hazard, they allow scientists to get an x-ray of the deep earth structure as the various seismic waves generated by the temblor travel through the crust, mantle, and core. However, because of the range of frequencies of the seismic waves, there is a blurry gap between 328 feet/100 meters from the surface and 3.1 miles/5 kilometers down. This region of the Earth is especially important because it can have a large impact on how much shaking will occur in different areas following larger earthquakes.
The rare and unique pressure waves from the HTHH volcanic explosion were enormous and moved at very high speeds, resulting in ground motions with that were well recorded on borehole seismometers (~328 feet/100 meters deep). The waveforms of ground motions recorded on seismometers are nearly identical to the pressure records, which allows scientists to infer that the pressure change is directly causing the ground motion. Stations emplaced on softer materials, such as the icecap at South Pole, Antarctica, recorded more motion in response to pressure than those situated on harder bedrock. By measuring both pressure and ground motion, scientists may be able to form a clear picture of the crust between 328 feet/100 meters and 3.1 miles/5 kilometers, filling in that blurry gap.

Explosions that large, and thus pressure waves with such large wavelengths, are a “once-in-a-lifetime” occurrence, so this event offers a unique opportunity to take advantage of data that doesn’t come along very often. The crustal structures that these data illuminate are used in many models for other purposes, such as determining the precise location of earthquakes and refining models of deep Earth structure.
Seismologists are also “under pressure” to improve the forecasting of earthquakes and rapidly estimate damage associated with them. While predicting earthquakes remains elusive, clearer pictures of crustal structure attained through pressure signals in the atmosphere has the capability to inform building codes and mitigate loss of lives and property following these events. And that’s a better picture for us all.
Read more here (actual link: https://pubs.geoscienceworld.org/ssa/srl/article-abstract/doi/10.1785/0…)