
Isolated travertine specimen from the USGS mineral collection. High-definition image showing banded texture and earthy color.
Images
Images
Filter Total Items: 274
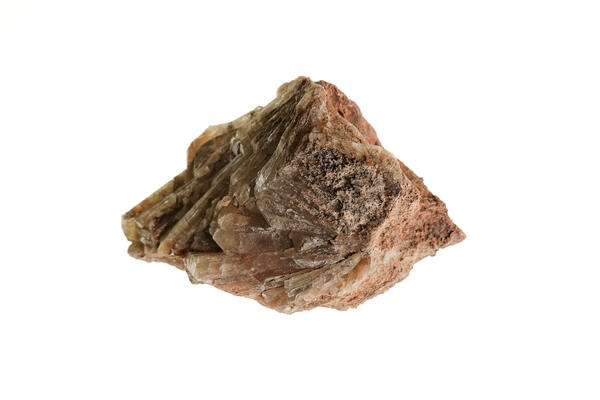
Calcite Travertine
Isolated travertine specimen from the USGS mineral collection. High-definition image showing banded texture and earthy color.
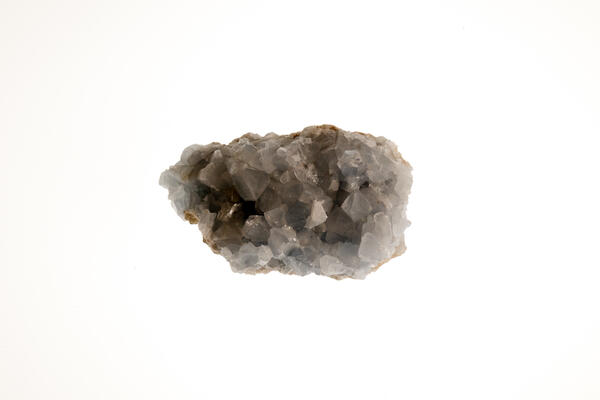
Celestite Crystal
Isolated celestite specimen from the USGS mineral collection. High-definition image showing pale blue color and prismatic crystal structure.
Isolated celestite specimen from the USGS mineral collection. High-definition image showing pale blue color and prismatic crystal structure.
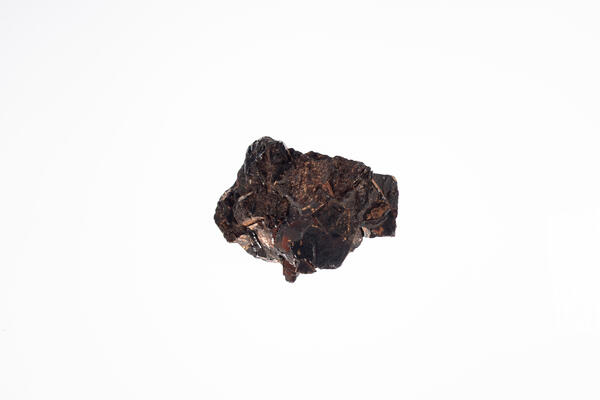
Rutile (Titanium Ore)
Isolated rutile specimen from the USGS mineral collection. High-definition image showing prismatic structure and reddish-brown color.
Isolated rutile specimen from the USGS mineral collection. High-definition image showing prismatic structure and reddish-brown color.
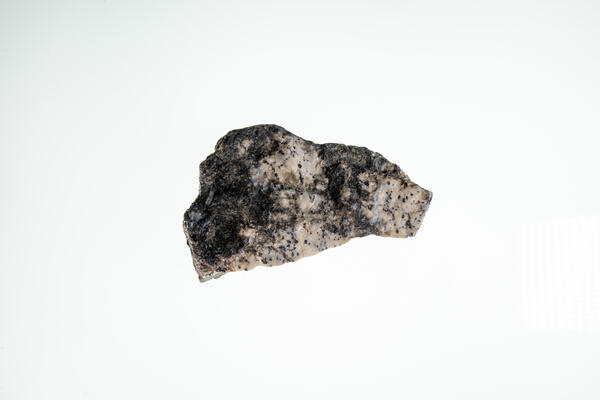
Wolframite (Tungsten Ore) 2
USGS mineral specimen of wolframite. High-definition image showing layered structure and metallic inclusions.
USGS mineral specimen of wolframite. High-definition image showing layered structure and metallic inclusions.

Vanadinite Specimen
Isolated vanadinite specimen from the USGS mineral collection. High-definition image showing hexagonal crystals and red-orange color.
Isolated vanadinite specimen from the USGS mineral collection. High-definition image showing hexagonal crystals and red-orange color.
Vanadium Sample 2
High-definition image of vanadium specimen with fine-grained texture and silvery color.
High-definition image of vanadium specimen with fine-grained texture and silvery color.

Zirconium Metal Sample
Isolated zirconium metal specimen from the USGS mineral collection. High-definition image showing metallic surface and smooth texture.
Isolated zirconium metal specimen from the USGS mineral collection. High-definition image showing metallic surface and smooth texture.
Hydrothermal Energy Resources (Illustrated GIF)
Conventional hydrothermal resources occur below the ground where three ingredients combine: heat, water and permeable rock. When heated water or steam is trapped in a porous rock below a layer of less permeable rock, a hydrothermal reservoir is formed.
Conventional hydrothermal resources occur below the ground where three ingredients combine: heat, water and permeable rock. When heated water or steam is trapped in a porous rock below a layer of less permeable rock, a hydrothermal reservoir is formed.
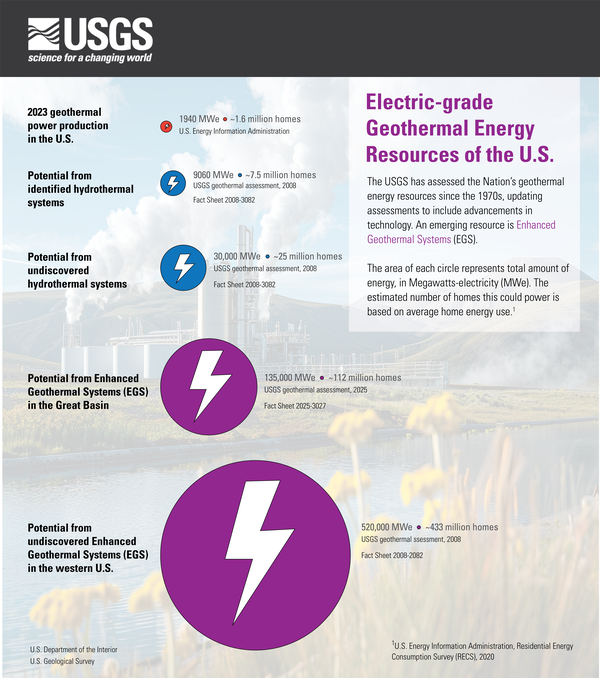
Electric-grade geothermal energy resources of the U.S.
Electric-grade geothermal energy resources of the U.S.Infographic of Electric-grade geothermal energy resources of the U.S.
The USGS has assessed the Nation’s geothermal energy resources since the 1970s, updating assessments to include advancements in technology. An emerging resource is Enhanced Geothermal Systems (EGS).
Enhanced Geothermal Systems (Illustrated GIF)
Enhanced Geothermal Systems are an emerging resource that the USGS studies. To generate electricity from these systems, fractures are engineered into deep, low-porosity hot rocks to allow water to circulate. Then, the heated water is pumped back to the surface, where the thermal energy is used to move a turbine and generate electricity.
Enhanced Geothermal Systems are an emerging resource that the USGS studies. To generate electricity from these systems, fractures are engineered into deep, low-porosity hot rocks to allow water to circulate. Then, the heated water is pumped back to the surface, where the thermal energy is used to move a turbine and generate electricity.

Electricity Generated by Renewable Energy in the U.S., 2000-2020
Electricity Generated by Renewable Energy in the U.S., 2000-2020Graph showing electricity generated by hydropower, wind, solar, bioenergy, and geothermal renewable energy sources in the U.S. from 2000-2020
Electricity Generated by Renewable Energy in the U.S., 2000-2020
Electricity Generated by Renewable Energy in the U.S., 2000-2020Graph showing electricity generated by hydropower, wind, solar, bioenergy, and geothermal renewable energy sources in the U.S. from 2000-2020

Critical.Mineral.Commodities.in_.Renewable.Energy.jpg
Critical.Mineral.Commodities.in_.Renewable.Energy.jpgInfographic about critical mineral commodities use in renewable energy, published online by the USGS Office of Communications and Publishing in June 2019.
Critical.Mineral.Commodities.in_.Renewable.Energy.jpg
Critical.Mineral.Commodities.in_.Renewable.Energy.jpgInfographic about critical mineral commodities use in renewable energy, published online by the USGS Office of Communications and Publishing in June 2019.

ERP_resources_graphic.png
This infographic shows some of the natural resources that the USGS Energy Resources Program studies, including oil and gas, geothermal, geologic hydrogen gas, carbon dioxide, wind, solar, coal, gas hydrates, uranium and water resources.
This infographic shows some of the natural resources that the USGS Energy Resources Program studies, including oil and gas, geothermal, geologic hydrogen gas, carbon dioxide, wind, solar, coal, gas hydrates, uranium and water resources.

3d geophysical map of the Idaho Cobalt Belt
This image shows a 3d visualization of geophysical data collected over the Idaho Cobalt Belt by the Earth Mapping Resources Initiative (Earth MRI).
This image shows a 3d visualization of geophysical data collected over the Idaho Cobalt Belt by the Earth Mapping Resources Initiative (Earth MRI).

Hydrogen Fuel Cell
Diagram of how a Hydrogen Fuel Cell functions, with inputs and outputs. Courtesy of the Department of Energy’s Energy Information Administration.
Diagram of how a Hydrogen Fuel Cell functions, with inputs and outputs. Courtesy of the Department of Energy’s Energy Information Administration.

Western North Slope Foothills
The Kukpowruk River cuts through folded Cretaceous rocks in the central North Slope. These rocks were assessed by the USGS in 2017 and lie above the rocks assessed in the USGS 2021 Western North Slope assessment.
The Kukpowruk River cuts through folded Cretaceous rocks in the central North Slope. These rocks were assessed by the USGS in 2017 and lie above the rocks assessed in the USGS 2021 Western North Slope assessment.

Tingmerkpuk Ridges
Jurassic rocks exposed in thurst-faulted structures near the southern limit of Western North Slope. In the subsurface farther north, these rocks may be reservoir rocks for natural gas.
Jurassic rocks exposed in thurst-faulted structures near the southern limit of Western North Slope. In the subsurface farther north, these rocks may be reservoir rocks for natural gas.

Western North Slope Foothills
Geologist hikes across folded Cretaceous rocks in the central North Slope. These rocks were assessed by the USGS in 2017 and lie above the rocks assessed in the USGS 2021 Western North Slope assessment.
Geologist hikes across folded Cretaceous rocks in the central North Slope. These rocks were assessed by the USGS in 2017 and lie above the rocks assessed in the USGS 2021 Western North Slope assessment.

USGS Technicians Prepare to Take a Core of the Austin Chalk in Texas
USGS Technicians Prepare to Take a Core of the Austin Chalk in TexasUSGS technicians at the USGS Gulf Coast #4 Bonham borehole in preparation for geophysical logging of the Austin Chalk Group and the Eagle Ford Group mudstones, Fannin County, Texas.

Austin Chalk Core
Bedding features in the core from the USGS Gulf Coast #4 Bonham borehole, in the Eagle Ford Group mudstones from a depth of about 401 feet, Fannin County, Texas. The Eagle Ford Group lies underneath the Austin Chalk and serves as the source rock for much of the Austin Chalk's petroleum.
Bedding features in the core from the USGS Gulf Coast #4 Bonham borehole, in the Eagle Ford Group mudstones from a depth of about 401 feet, Fannin County, Texas. The Eagle Ford Group lies underneath the Austin Chalk and serves as the source rock for much of the Austin Chalk's petroleum.

Tingmerkpuk Ridges
Geologists discuss the geology of Jurassic rocks in thurst-faulted structures near the southern limit of Western North Slope.
Geologists discuss the geology of Jurassic rocks in thurst-faulted structures near the southern limit of Western North Slope.