USGS Online Mapper Provides a Decadal Look at Groundwater Quality
The online mapper examines decadal changes in 24 contaminants
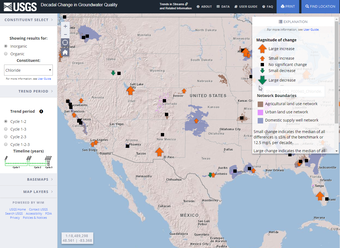
A new online interactive mapping tool provides summaries of decadal-scale changes in groundwater chemistry across the Nation.
About 140 million people—almost one-half of the Nation's population—rely on groundwater for drinking water. Tracking changes in groundwater quality and investigating the reasons for these changes are crucial for informing management decisions to protect and sustain our valuable groundwater resources.

The interactive mapping tool is based on data from over 5,000 wells sampled between 1988 and 2020 in a series of 67 networks across the United States by the National Water-Quality Assessment Project. Each groundwater network consists of about 20 to 30 wells. Networks were chosen based on geographic distribution across the Nation to represent the most important water-supply aquifers and specific land use types.
This tool can be used to:
- Track how concentrations of 24 contaminants (such as nutrients, pesticides, metals, and volatile organic compounds) are changing over decadal periods
- View the distribution of wells sampled within an aquifer
- Download water-quality data
- Learn more about the statistical approaches used to track decadal changes in groundwater quality.
The U.S. Geological Survey (USGS) National Water-Quality Assessment Project provided the funds to develop the online tool.
See below for related data.
Data from Decadal Change in Groundwater Quality Web Site, 1988-2018 Data from Decadal Change in Groundwater Quality Web Site, 1988-2018
Data from Decadal Change in Groundwater Quality Web Site, 1988-2014, Version 2.0 Data from Decadal Change in Groundwater Quality Web Site, 1988-2014, Version 2.0
A new online interactive mapping tool provides summaries of decadal-scale changes in groundwater chemistry across the Nation.
About 140 million people—almost one-half of the Nation's population—rely on groundwater for drinking water. Tracking changes in groundwater quality and investigating the reasons for these changes are crucial for informing management decisions to protect and sustain our valuable groundwater resources.

The interactive mapping tool is based on data from over 5,000 wells sampled between 1988 and 2020 in a series of 67 networks across the United States by the National Water-Quality Assessment Project. Each groundwater network consists of about 20 to 30 wells. Networks were chosen based on geographic distribution across the Nation to represent the most important water-supply aquifers and specific land use types.
This tool can be used to:
- Track how concentrations of 24 contaminants (such as nutrients, pesticides, metals, and volatile organic compounds) are changing over decadal periods
- View the distribution of wells sampled within an aquifer
- Download water-quality data
- Learn more about the statistical approaches used to track decadal changes in groundwater quality.
The U.S. Geological Survey (USGS) National Water-Quality Assessment Project provided the funds to develop the online tool.
See below for related data.

