
What's New?
Check this page each Tuesday for new things to explore!
Week 4: 4/7

This week, we’re focusing on the USGS Water Science School resources, a comprehensive teaching guide to all things water-related. There are plenty of gems within, so feel free to look around and see what you like best. Some of the “greatest hits” are listed below for you to enjoy. To learn more about how the USGS monitors and researches water, visit the Water Resources Mission Area website.

The USGS Water Science School has water cycle maps for learners of all ages, including downloadable versions (they make great placemats) online interactive versions. They are available in 30+ languages for young kids, and over 60 languages for older learners. Follow this link to learn all about the water cycle.

All Ages: Surface Water
Earth is known as “The Water Planet” and the presence of water is the main factor that makes Earth habitable by abundant plants and animals. Check out a cool map of water availability in the United States with the National Integrated Water Availability Assessments Concept Map. It is showing you readily available water at the surface (in ponds, soil, snow) and in shallow ground water, but not deep groundwater or rivers. Click on the letter “I” for more information about how the map was made. Click on the bullseye on the lower right to zoom in to where you are. Note the date on the map. When you zoom in you can see topography and large lakes and rivers.
- Where in the US is there a lot of water right now?
- Where is there very little?
- Think about the weather lately near you – does the water in your area match your predictions based on local weather?

Grades 3-12: WaterWatch is a USGS product that displays maps, graphs, and tables describing real-time, recent and past streamflow in the U.S. A streamgage is a small station that contains instruments that measure and record the amount of water flowing in a river or stream or its discharge. In the late 1800’s John Wesley Powell, the second director of USGS, proposed gaging the flow of rivers and streams to evaluate their potential for irrigation for farming, as well as for use in designing water-supply systems
USGS supports one of the largest streamgaging operations in the world – over 10,000 gages transmit data to USGS computers within one hour of measurement. The data are provided online, real-time to meet today’s diverse needs for water information such as flood warning, water allocation, and recreation. Is there a streamgage station in your neighborhood?
How might you use this mapper?
- Click on the Current Streamflow link on the left of the map. Pick your state from the dropdown menu. Each dot is a USGS streamgage. Hover over a dot to find out where it is. Note the color of the dots – they tell you whether the flow is higher or lower than normal.
- Click on any dot to see the data for the gage. It also shows you graphs.
- Think about these questions: Which areas of your state are below normal to low? How about the areas that are above normal to high? How might you use this data in your everyday plans? How might people in your community use this data?
- Click on the Animation link on the left of the map and choose Real-Time Maps by Month. Choose March or an earlier month and watch for patterns in streamflow across the U.S.
- Think about these questions: Which areas in the U.S. appear to have above normal or high streamflow, and in which months? Where are drought conditions occurring (below normal streamflow) and how long have these conditions persisted (look for options to change months)? Why are these data important? Who may use these data for their job?
High School challenge: Go back to a state map, and hover over any streamgage. Click on the gage number, which is a link. This leads you all of the data for that gage going back decades – even 100 years. You can choose daily, monthly, or yearly data. You can choose peak stream flow (annual) and water quality data. Download the data and make some graphs. How often does the stream flood? Is there a typical time of year? Have the flow or flood patterns changed over time? Here are some definitions to get your started:
- Discharge is the amount of water moving down the stream at any time, measured in cubic feet per second. That number, of course, gets bigger when the river rises and moves faster. It is also a function of the size of the river. A large, slow river will have a higher discharge than a small, fast creek.
- Gage height is a measure of the top of the water above (or below) a set reference point.

High School: Water Quality
Water-Quality Changes in the Nation’s Streams and Rivers
This is a visualization (mapper) of water quality changes in the U.S. and is an output of the largest-ever evaluation of water quality changes in the Nation’s streams and rivers. It includes records from over 600 Federal, State, Tribal and local organizations who monitor water quality.
The mapper shows trends in water chemistry (nutrients, pesticides, sediment, carbon, and salinity) and aquatic ecology (fish, invertebrates, and algae) for four time periods: 1972-2012, 1982-2012, 1992-2012, and 2002-2012. The mapper is organized by choices you make on the left (Base Maps, and Map Layers). Choose your variables of interest (Constituent group and Constituent), and the Trend type and Trend period to focus your study. A link to the User Guide is provided at the top of the map.
1. Fact: The Federal Water Pollution Control Act Amendments of 1972 (Clean Water Act) was one of the U.S.’s first and most influential environmental laws and for the first time regulated the concentration of nutrients (nitrogen and phosphorus) released by industrial, government and agricultural facilities.
Questions to explore: Can you see observe a pattern in nitrogen and phosphorus concentrations in streams and rivers in the U.S. over time? Where are concentrations still high, and can you make a data-driven guess on why?
2. Fact: The Environmental Protection Agency (EPA) is responsible for regulating the use of pesticides by the agricultural industry. For example, the pesticides Atrazine, and Cyanazine concentrations are monitored and regulated by EPA.
Questions to explore: Why do you think these chemicals may be important to regulate? Can you observe a pattern of their concentrations in streams and rivers in the U.S. over time? Can you make a data-driven guess about when these pesticides were regulated?

All ages: What is water clarity? (parents, you will want to help younger children)
Water can be very clear, too murky to see through, or anything in between. Clarity varies in natural water based on a wide variety of factors including recent rainfall, runoff, discharge rate, and temperature. Learn all about water clarity here.
What can you learn from the clarity and color of water? Learn some basic water sampling techniques that you can do near your own house, and what you can learn about the water you collect. One simple tool is called a Secchi disc, which is a weighted disk with white and black quarters on the top and something to lower it into the water (commonly a measuring tape). One measure of water clarity is the depth to which you can see the black and white design. In very clear water, that might be many feet; in muddy water, perhaps an inch or two.
Want to make your own Secchi disk? You can find examples of how to make your own: GLOBE Secchi disc or SERC Secchi disc. For a super easy DIY Secchi disk, you can even glue 2-3 old CDs together (one alone will not sink). You can use paint or nail polish for the black and white sections.

What does the water near YOU look like?
Water doesn’t look the same everywhere. It can be many different colors and can have varying clarity (can you see through it?). Take a look at water near you (safely!) and share a photo. Old photos are also fine. Share what you learned with others with our current Find-A-Feature Challenge to learn more about the water where YOU live. See what others have posted by searching Twitter for #findafeature and #waterclarity. Feel free to tag us @USGS_YES, too!
Week 3: 3/31
Space Week!
All Ages: Exploring the Solar System If you could explore anywhere in the solar system, where would it be and why? What would you need to take with you to keep you safe from extreme temperatures (Venus is hot, Mars is cold), different amounts of gravitational pull (the Moon’s gravity is much lower than Earth’s), and to provide food and fuel? How would you get where you are going, and what would you expect to see when you get there? How do you know what the most interesting places might be?
This week we challenge all learners to explore the solar system. We share some work of lunar explorers, maps from planets and moons across the solar systems, and engineering challenges to start thinking about how and why space exploration is so exciting.

All Ages: To the Moon! USGS geologists have worked closely with NASA on out-of-this-world science for over 50 years, including helping to train the Apollo astronauts to walk on the uneven lunar surface, choosing landing sites, testing lunar rovers, and even to helping to understand which moon rocks would be the best rocks back to Earth. They even used dynamite to make craters in a lava field to mimic the lunar surface – watch a short video about that here. Ask your parents or grandparents about their experience watching the astronauts land on the Moon for the first time in history and learn more at the astrogeology’s Lunar Legacy page. You can also watch an hour-long lecture by the USGS Astrogeology Science Center Director here.
Grades 3-8 PLANETS Curriculum. There are a lot of complex challenges involved with traveling to outer space. USGS has partnered with Northern Arizona University and the Museum of Science Boston to create PLANETS (Planetary Learning that Advances the Nexus of Engineering, Technology, and Science). Units include:
Remote Sensing (Grades 6-8)
Water in Extreme Environments (Grades 6-8)
Space Hazards (Grades 3-5)
While these are specifically designed for 3-8th graders, older students can use these challenges in more complex ways.
Grades 6-12: The US Geological Survey partners with many other federal agencies, including NASA. In fact, the USGS has an entire Science Center that focuses on Astrogeology – the geology of other planets and moons! The Astrogeology Science Center is located in Flagstaff, Arizona. They create geologic maps, host the Regional Planetary Information Facility (RPIF) which houses more than 100,000 lunar and planetary maps, a library, and photo and document archives, and actively research places that humans have never even visited. How do they do that?
Learn more about how maps are made from so far away. If you were heading to Mars (and some of you may walk on Mars during your lifetime) why would it be helpful to have an accurate map? Become a space expert by looking at some cool maps here and even more maps at the NASA/USGS Planetary Mapping Program. Also, the upper left buttons on the Astropedia page allow you to select a planet or moon in our solar system and easily download free maps, images, and tons of information.
Unsure where to begin? Here are some suggestions for moons to explore, with their home planets in parentheses.
Rocky Moons: Io (Jupiter), Ganymede (Jupiter), Titania (Uranus)
Icy Moons: Europa (Jupiter), Enceladus (Staurn), Triton (Neptune)
Planet-Like Moon: Titan (Saturn)
Lumpy Moons: Phobos (Mars), Deimos (Mars), Thebe (Jupiter)

All Ages: Be an Explorer! USGS scientists have been exploring our planet and beyond for 150 years. Head over to our Be an Explorer website and download our poster and follow USGS explorations! Want to create your own adventures? Download and print one of our Paper Explorers and take him or her on an adventure. You can even mail your paper explorer to a relative or friend to explore somewhere you can’t get to right now. Share your explorations with us by tagging @USGS_YES on social media and using the hashtag #paperexplorer


All Ages: Do you know your Moon phases? Although often associated with night time, Earth's Moon is also visible during the day, it just can be harder to see. Do you know waxing from waning? How about first or last quarter? You’ve probably seen a crescent moon, but what about a gibbous moon? Download our Phases of the Moon sheet here, and take a look at the sky (note, you’ll only see the unshaded parts of the diagram below).
Do these look a little like bit like cookies? You can make your own phases of the moon models with sandwich cookies and a plastic knife at home – science can be quite tasty! See the NASA tutorial here.
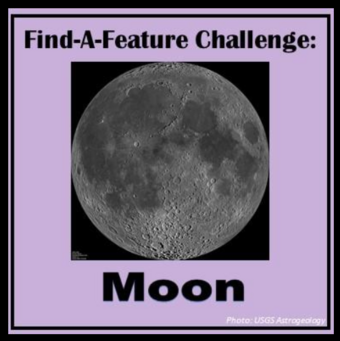
Once you find the Moon in the night sky (or during the day), you can play our Find-A-Feature Challenge about the Moon, too. Have fun! Tip: April 1st is the first quarter Moon, which means that it is a quarter of the way through it's monthly ("moonthly") revolution around Earth. It looks like a capital "D" in the sky and rises around noon and sets around midnight.
Week 2: 3/24

All Ages: Change over Time with Cherry Blossoms – Many varieties of cherry blossoms are at their “peak bloom” this week. Washington DC is famous for the Cherry Blossom trees around the National Mall.
How about a little math? The link above has data on the dates of six different stages of the blooms. You can plot these in a couple of different ways.
1) If you are interested in how long it takes from stage to stage, put time on the X-axis and the stages on the Y-axis and use a different color or symbol ro each year.
2) If you are interested in whether the bloom time-of-year is shifting, pick one stage and plot bloom date vs. year.
Can you find cherry blossoms or other trees blooming around you? Perhaps from looking out of your kitchen window?

All Ages: The USGS is the primary source for topographic maps of the USA. Watch this cool video about how topographic maps are made, and learn all about maps here! You are invited to participate in USGS Citizen Science with National Map Corps, an online crowdsourcing mapping project with volunteers editing structures including schools, hospitals, post offices, police stations, cemeteries, and other important public buildings.
Anyone can volunteer, you need access to the internet, an email address. Get going with the User Guide and the Quick Start Guide. Begin in your own hometown or anywhere in the U.S., Puerto Rico, or the U.S. Virgin Islands. Volunteers use an online web mapping application to place points that represent buildings or other structures. Citizen scientist participants earn virtual badges as they increase their number of submitted “points”.
New challenges are being released all the time – here are a couple of the current challenges for Georgia and South Carolina.
NEW TNMCorps Mapping Challenge for Schools in GA & SC
NEW TNMCorps Mapping Challenge for City/Town Halls in GA & SC
How does the USGS use these data?
Volunteers research and update data that becomes part of The National Map structures dataset, which is available for download free of charge. The data that citizen scientists collect provides an avenue to update building and other structure data on USGS map products making them more accurate and reliable for public use.
Citizen Scientists really do help – 20 points of data were collected in a week (3/5/2020 – 3/12/2020). Mapping Challenge Update (3/12/2020): City/Town Hall Structures in Arkansas

Grades K-3: Draw a map of your bedroom, or even of your whole apartment or house! Look around you, what do you see? Where are the big things, like beds, couches, tables, and chairs. How many windows and doors do you have, and where are they? Make your own scale (something to compare the size of things) such as the length of a pencil-top eraser or an inch on a ruler so you know how much space items take up in your room. You did it! If your parents want to, they can share your map with other kids on Twitter, Instagram, or Facebook with the hashtag #mapmyroom and tag @usgs_yes.
Or, have fun making your own DIY 3D topo map with some leftover salad trays. You can find the tutorial here!

Grades 3-6: Map Attack! Download just about any type of map that you can imagine (topo maps, geologic maps, maps of other planets, and more) from the USGS store. You can even download this blank map of the USA and try to fill in as many state names – and capitals? – as you can!

Grades 6-8: Evaluating Glacier and Landscape Change: Repeat Photography Project
Visit Glacier National Park from your own home. See side-by-side photographs taken from the same locations at different times and see for yourself what has changed. What do you notice?
Download this lesson plan here and learn more about the USGS’ Repeat Photography Project in Glacier National Park here.

Grades 6-12: Looking at the online cherry blossoms this year? Did you spot the monuments on the National Mall? Learn more about the geology of the stones that make up many of the monuments and buildings in Washington, DC with this Building Stones of our Nation’s Capital fact sheet.
Week 1: 3/17
It is March, 2020 and spring is upon us. Take a look at these ways to celebrate spring!
ALL AGES: The National Phenology Network (NPN)
NPN brings together citizen scientists, government agencies, non-profit groups, educators and students of all ages to monitor seasonal life-cycle events (phenology) to assess the impacts of climate change on plants and animals in the U.S. You can join and become and NPN observer, collecting data on plants and animals in your backyard and your neighborhood, at Nature’s Notebook. Join the Nature’s Notebook community, set-up an account, and start by choosing animals or plants species searching for projects in your local area. Take a look around you, and report what you see!
(Note to Parents: USGS and NPN do not share identifying information about with anyone. See the privacy policy here.)
USGS is a collaborating agency with the NPN and uses data gathered by citizen scientists. For example, NPN data was used to document a 4% extension of the growing season in the Eastern US over the last three decades, which has implications for maple syrup and honey production, bird migration, harvesting of gardens and native plants and cultural festivals. Go to USGS National Phenology Network (NPN) to see more examples of how citizen science projects like NPN help USGS to manage ecosystem and human health risks.
USGS Article: The USA National Phenology Network; taking the pulse of our planet

ALL AGES: Change over time in YOUR neighborhood!
Happy Springtime! Did you know that the USGS studies biology and ecosystems, too? We challenge you to have fun observing change over time. Take a series of pictures over the next several days or weeks from the SAME place. Use something for scale (a ruler, pencil, your foot, etc.) so others can tell how much it has changed over time. What changes do you see? Why do you think those changes may have happened? Week One challenge: Flowers. Ready, set, go! Share your pics on Twitter/IG/FB by tagging @usgs_yes and using the hashtags #changeovertime and #scienceiseverywhere.
USGS Articles: Tracking Change Over Time Publication GIP133
Tracking Change Over Time Teaching Guide (Grades 5-8)
Change Over Time Satellite Imagery

Grades K-2: USGS Kids!
Check out our stories, coloring pages, mazes and dot-to-dots at the USGS Kids site. There are even design plans for building a birdhouse.
There are challenges for older kids here too.
And there are sea otter coloring pages as well
Grades 3-12: Be an Otter Spotter!

Read about USGS Sea Otter studies and see if you can spot the otters in the sea kelp at this site. Then click on Related Science and click on the Near Shore project and the Population Biology link to learn more about how and why USGS studies this species.
Want to see a video? Here’s one.
Here is a fact sheet about sea otters.
Here is a Fish and Wildlife site about sea otters.
There are a lot of great otter photos online. Do an image search of “sea otter usgs.gov” and print some of your favorites. Perhaps you can write a book about what you have learned about Sea Otters and use some great photos, or your own art, to illustrate it.