
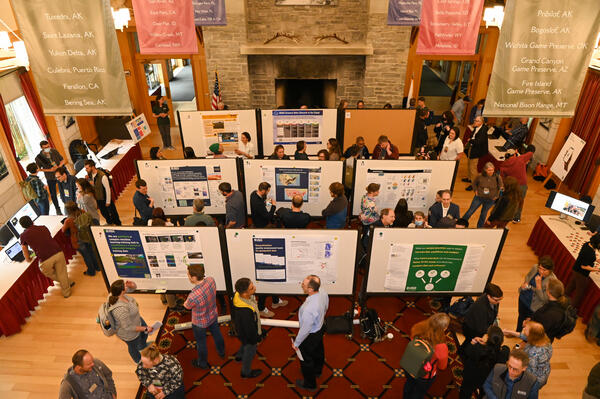
Photograph of the Community for Data Integration (CDI) DataBlast from May 2023. The DataBlast is CDI's version of a poster session.
Multimedia
Multimedia
Images
2023_CDI_DataBlast.jpg
Photograph of the Community for Data Integration (CDI) DataBlast from May 2023. The DataBlast is CDI's version of a poster session.
GSlogo_0.png
This is the graphic used for the Geophysical Survey data standard and python library (GSPy).
This is the graphic used for the Geophysical Survey data standard and python library (GSPy).
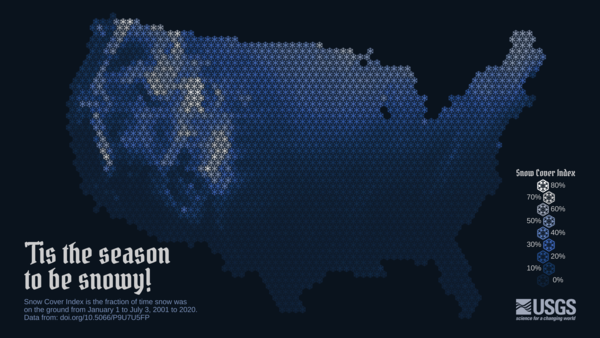
'Tis the season to be snowy
Snowflake hex map of the contiguous United States created by the USGS VizLab.
See Origin and development of a Snowflake Map | Water Data For The Nation Blog (usgs.gov) for more information.
Snowflake hex map of the contiguous United States created by the USGS VizLab.
See Origin and development of a Snowflake Map | Water Data For The Nation Blog (usgs.gov) for more information.