
Seismic monitoring is the most used technique for volcano surveillance.
As magma moves through the earth, it displaces and fractures rock along the way. This movement causes earthquakes that can be recorded with seismometers at the surface of the earth. Seismic monitoring is the most used technique for volcano surveillance.
Volcanic earthquakes often provide the initial sign of volcanic unrest. Their signals differ from typical, tectonic, earthquakes because they tend to be found at depths shallower than 10 km, are small in magnitude (< 3), occur in swarms, and are restricted to the area beneath a volcano. Harmonic tremor, or volcanic tremor, is the name for the continuous, rhythmic seismic energy associated with underground magma movement.
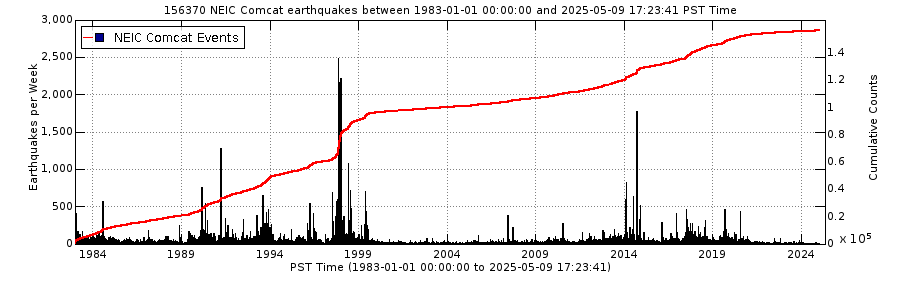
The vertical bars on the graphs below correspond with the left-side y-axis and represent the number ofearthquakes per day. The red line indicates the cumulative number of earthquakes and corresponds with the right-side y-axis.
Earthquake swarms occurred at Long Valley from 1978-1983, 1990-1995, 1996, and 1997-1998. The rate of earthquakes since the end of the last swarm has been relatively low considering the history since seismic monitoring started.
Seismic monitoring is the most used technique for volcano surveillance.
As magma moves through the earth, it displaces and fractures rock along the way. This movement causes earthquakes that can be recorded with seismometers at the surface of the earth. Seismic monitoring is the most used technique for volcano surveillance.
Volcanic earthquakes often provide the initial sign of volcanic unrest. Their signals differ from typical, tectonic, earthquakes because they tend to be found at depths shallower than 10 km, are small in magnitude (< 3), occur in swarms, and are restricted to the area beneath a volcano. Harmonic tremor, or volcanic tremor, is the name for the continuous, rhythmic seismic energy associated with underground magma movement.
The vertical bars on the graphs below correspond with the left-side y-axis and represent the number ofearthquakes per day. The red line indicates the cumulative number of earthquakes and corresponds with the right-side y-axis.
Earthquake swarms occurred at Long Valley from 1978-1983, 1990-1995, 1996, and 1997-1998. The rate of earthquakes since the end of the last swarm has been relatively low considering the history since seismic monitoring started.