
Seismic and deformation monitoring data.
Seismic Data
Earthquake Hypocenters Map and Cross Section - Past 5 Years
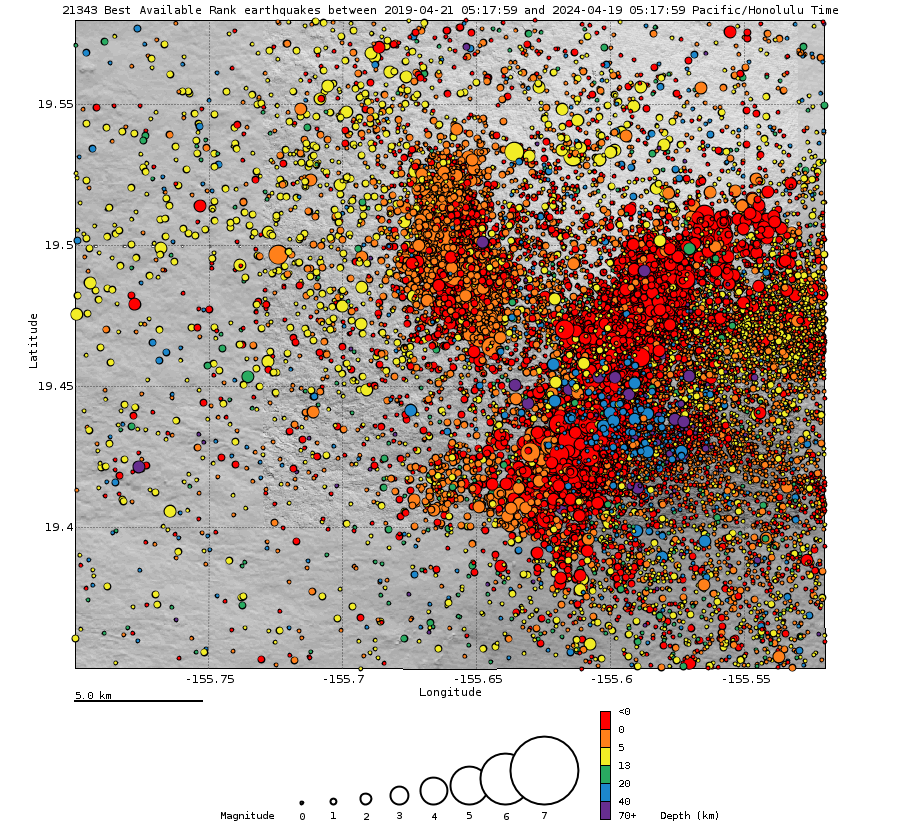

Above Top: Map showing locations of earthquakes during the past year. Bottom: Depth of earthquakes (circles) during the past five years. Depth is reported relative to sea level, which is equal to a depth of zero on the above plot. Circle-size represents magnitude, and color indicates depth. An interactive earthquakeplot can be found on the HVO Earthquakes page.
Earthquake Rates and Depths - Past 5 Years
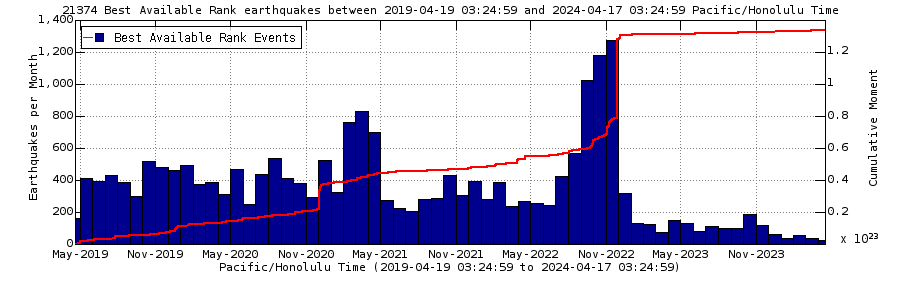
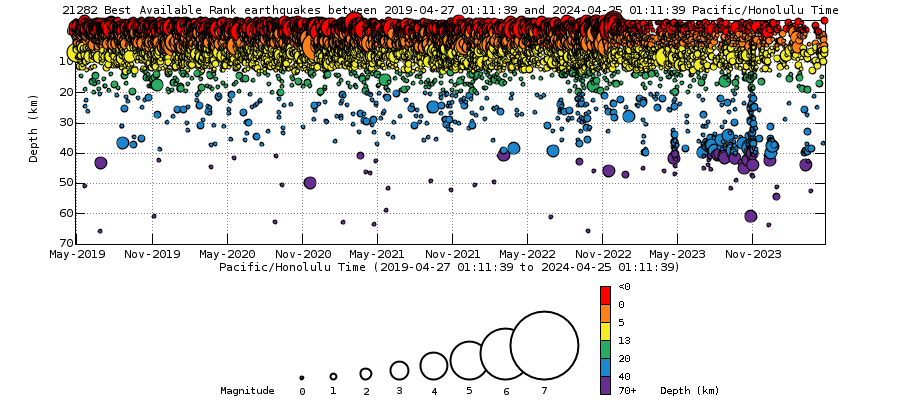
Above Top: Number of earthquakes per month during the past five years (blue bars). The red line is the cumulative moment (energy) release. Bottom: Depth of earthquakes during the past week in the area shown on the map above. Depth is reported relative to sea level, which is equal to a depth of zero on the above plot. On both figures, circle-size represents magnitude, and color indicates depth. An interactive earthquake plot can be found on the HVO Earthquakes page.
Deformation Data
Global Positioning System - Past 5 Years
Cross-caldera Distance Change

Above: Changes in distance between two GPS stations on opposite sides of Mokuʻāweoweo, Mauna Loa's summit caldera. Extension across the caldera is often an indication of inflation of the shallow summit magma reservoir.
Summit Vertical Motion
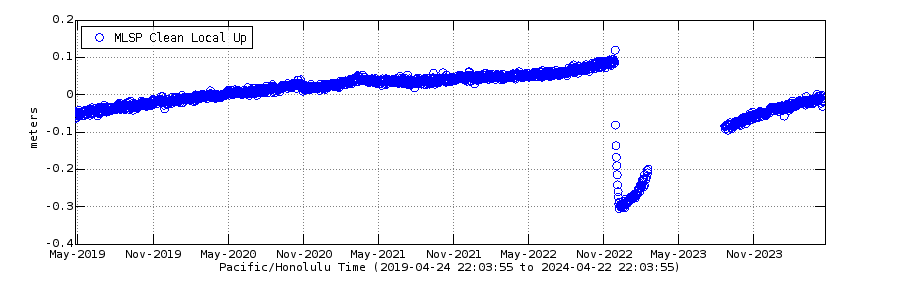
Above: Vertical motion of a GPS station on the southeast side of Mauna Loa's summit caldera. This station is in an area that has historically shown the largest amount of uplift with inflation.

Map of Selected Deformation Stations
For more information on how electronic tiltmeters and GPS receivers help monitor the deformation of Mauna Loa Volcano, see the HVO Deformation page.
Related Information
-

Past Year Monitoring Data for Mauna Loa
Seismic and deformation monitoring data.-
Past Month Monitoring Data for Mauna Loa
Seismic and deformation monitoring data. 
Past Week Monitoring Data for Mauna Loa
Past week monitoring data for Mauna Loa.-
Monitoring Data for Mauna Loa
For more information on how electronic tiltmeters and GPS receivers help monitor the deformation of Kīlauea Volcano, see the HVO Deformation page.
Monitoring Data for Mauna Loa
Past Month Monitoring Data for Mauna Loa
Past Week Monitoring Data for Mauna Loa
Past Year Monitoring Data for Mauna Loa
Seismic and deformation monitoring data.
Seismic Data
Earthquake Hypocenters Map and Cross Section - Past 5 Years
Above Top: Map showing locations of earthquakes during the past year. Bottom: Depth of earthquakes (circles) during the past five years. Depth is reported relative to sea level, which is equal to a depth of zero on the above plot. Circle-size represents magnitude, and color indicates depth. An interactive earthquakeplot can be found on the HVO Earthquakes page.
Earthquake Rates and Depths - Past 5 Years
Above Top: Number of earthquakes per month during the past five years (blue bars). The red line is the cumulative moment (energy) release. Bottom: Depth of earthquakes during the past week in the area shown on the map above. Depth is reported relative to sea level, which is equal to a depth of zero on the above plot. On both figures, circle-size represents magnitude, and color indicates depth. An interactive earthquake plot can be found on the HVO Earthquakes page.
Deformation Data
Global Positioning System - Past 5 Years
Cross-caldera Distance Change
Above: Changes in distance between two GPS stations on opposite sides of Mokuʻāweoweo, Mauna Loa's summit caldera. Extension across the caldera is often an indication of inflation of the shallow summit magma reservoir.
Summit Vertical Motion
Above: Vertical motion of a GPS station on the southeast side of Mauna Loa's summit caldera. This station is in an area that has historically shown the largest amount of uplift with inflation.
Map of Selected Deformation Stations
For more information on how electronic tiltmeters and GPS receivers help monitor the deformation of Mauna Loa Volcano, see the HVO Deformation page.
Related Information
-
-
Past Year Monitoring Data for Mauna Loa
Seismic and deformation monitoring data. -
Past Month Monitoring Data for Mauna Loa
Seismic and deformation monitoring data. -
Past Week Monitoring Data for Mauna Loa
Past week monitoring data for Mauna Loa. -
Monitoring Data for Mauna Loa
For more information on how electronic tiltmeters and GPS receivers help monitor the deformation of Kīlauea Volcano, see the HVO Deformation page.
Monitoring Data for Mauna Loa
Past Month Monitoring Data for Mauna Loa
Past Week Monitoring Data for Mauna Loa