
Understanding Streamflow Drought: Impacts on Water, Land, and Communities
In this activity students will learn what streamflow drought is, how it has affected the United States over time, and how people and communities adapt to drought conditions.
Understanding Streamflow Drought: Impacts on Water, Land, and Communities - Lesson Plan [PDF]
What is streamflow drought? - Data Visualization
Five droughts that changed history - Data Visualization

Understanding Streamflow Drought: Impacts on Water, Land, and Communities
Objective:
Students will learn what streamflow drought is, how it has affected the United States over time, and how people and communities adapt to drought conditions. Students will use interactive USGS visualizations to explore the science of streamflow drought, analyze historical and real-world data, and think critically about water management. This activity aligns with Next Generation Science Standards for high school science education.
Next Generation Science Standards (NGSS) Standards:
- DCIs: ESS2.C: the roles of Water in Earth’s Surface Processes, ESS3.A: Natural resources, ESS3.C: Human Impacts on Earth Systems, ESS3.D Global Climate Change
- CCCs: Cause and effect, stability and change, systems and systems models, energy and matter
- SEPs: Developing and using models, analyzing and interpreting data, constructing explanations and designing solutions, engaging in argument from evidence.
Key Terms:
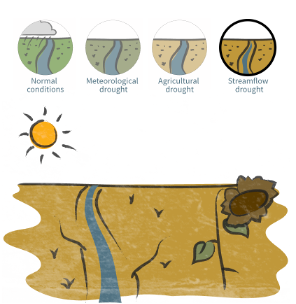
- Streamflow drought – A period when streamflow levels fall below what is normal for that site due to prolonged dry conditions.
- Drought severity – A classification of drought based on its duration and intensity, often categorized as abnormally dry, moderate, severe, or exceptional.
- Drought duration – The length of time a drought persists, from onset to recovery.
- Drought intensity – Describes how severe a drought is compared to normal conditions.
- Drought frequency – The occurrence rate of droughts within a specific time frame.
- USGS streamgages – Monitoring stations that measure streamflow levels at a specific location.
Think - Individually
Think about the last time you heard about a drought in the news:
- Where was it happening?
How did it affect people, agriculture, or the environment?
- How did local communities adapt to limited water supplies?
Using the following data visualization page from USGS VizLab to complete the activity.
https://water.usgs.gov/vizlab/what-is-drought/index.html
Review - Pair or Group Discussion
Read the entire passage on the “What is streamflow drought?” visualization and discuss. Make sure to keep scrolling to read all the content. Use the page navigation guide at the bottom to review the content as you answer the following questions.
- What is meteorological drought? How can it progress to agricultural drought?
- How does agricultural drought affect farmers, water supply, and food security?
What is streamflow drought, as compared to meteorological or agricultural drought?
How do scientists determine when a river is in streamflow drought?
Why is it important to compare current drought to historical averages for planning?
Using the following data visualization page from USGS VizLab to complete the following activity.
https://labs.waterdata.usgs.gov/visualizations/drought-timeline/index.html - /
Analyze and Reflect - Answer individually or in small groups
Comprehension
Open the Drought Timeline Visualization from USGS. Explore major drought periods in U.S. history from 1921–2020. Pay attention to the text that appear below the map that changes as you scroll.
- Scroll down through the years. What patterns do you notice in when and where droughts occurred?
- Which periods (e.g., Dust Bowl, 1950s, Turn-of-the-Century) show the largest areas in drought? Which show the smallest?
Compare the Dust Bowl era (1930s) with more recent periods (Turn-of-the-Century, 2000s, 2010s). What similarities and differences do you notice in impacts on communities, agriculture, and ecosystems?
How do drought-affected regions shift over time? How might these shifts affect local economies and natural habitats?
- Using the regional chart interaction at the bottom, determine which drought period affected the region you live in the most. Had you heard of this drought period, or of any of the impacts on your region?
Data Interpretation - Use the Drought Timeline Visualization to answer the following questions:
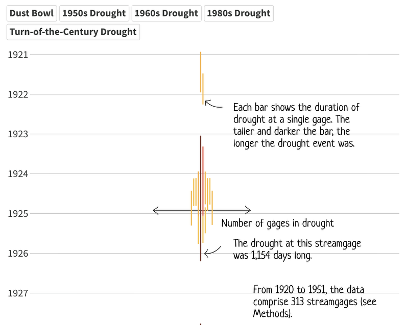
- On the bar graph
- What do the darkest colors represent? What do the lighter colors represent?
- What does the length of the bar represent?
- What does it mean when there graphed data get wider?
What trends do you notice in drought frequency or duration from 1921–2020? Explain.
- Using the regional chart interaction at the bottom, determine which regions are historically more prone to drought.
How might these observed trends influence water management, agriculture, urban planning, and ecosystem protection in different parts of the U.S.?
Challenge -Design a Community Water Plan
Imagine your town is entering its second year of streamflow drought. You are part of a water management team. Using evidence from USGS visualizations and https://www.usgs.gov/special-topics/drought propose three actions your town could take to:
- Ensure enough water for people’s daily needs
- Support farmers and food production
- Reduce long-term impacts of drought on (pick one) the economy, environment, or local ecosystems
Helpful Links:
https://water.usgs.gov/vizlab/what-is-drought/index.html
https://labs.waterdata.usgs.gov/visualizations/drought-timeline/index.html#/