
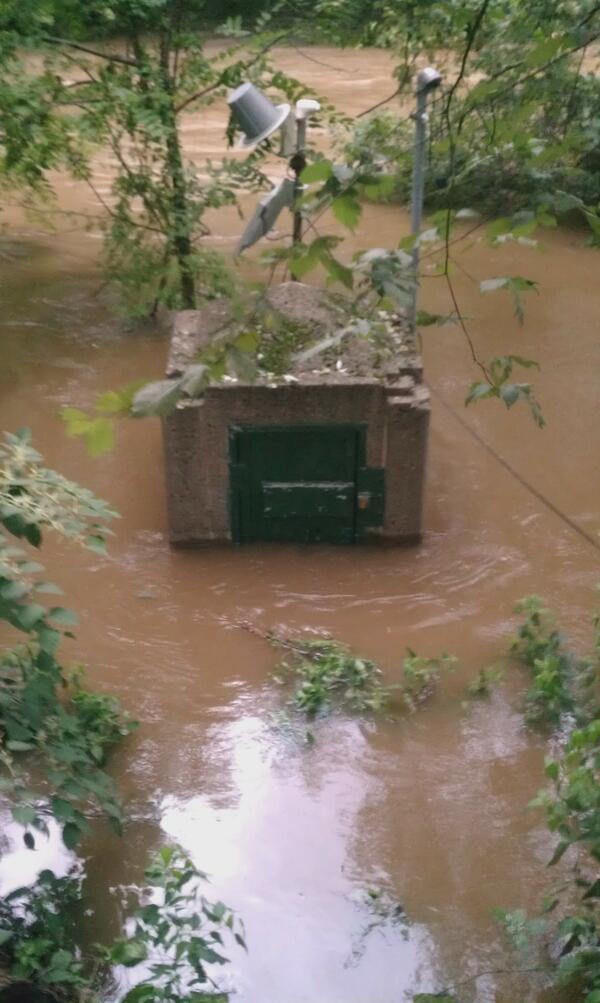
Flooding at the streamgaging station on the Saddle River at Lodi, NJ (U.S.Geological Survey station 01391500), after the peak on August 28, 2011.
By New Jersey Water Science Center
October 20, 2011
Hurricane Irene moved up the eastern seaboard making landfall for a second time at Little Egg Inlet New Jersey early Sunday morning August 28, 2011. This is the first time a Hurricane made landfall in New Jersey since 1903.
Thirty-eight of the 93 gages with greater than or equal to 20 years of record had record high peaks. Another 24 gages recorded the second highest peaks of record and 5 gages recorded the third highest peaks of record. Thirty gages experienced peaks greater then the 100 year recurrence interval and ten of these gages experienced greater than a 500 year event.
Introduction
Rainfall totaling as much as 10 inches fell during August 27–28, 2011 and, combined with wet antecedent conditions caused by 8 to 16 inches of rain statewide during the 3 weeks preceding Hurricane Irene, set the stage for record-breaking floods on many streams in New Jersey. Thirty-nine of the 94 gages with greater than or equal to 20 years of record had record high peaks. Thirty-three gages experienced peaks equal to or greater than the 100-year recurrence interval (< 1.0% annual exceedance probability). The President signed a Major Disaster Declaration FEMA-DR-4021 on August 31, 2011, for all 21 counties in New Jersey.
This report describes conditions preceding and during Hurricane Irene. The locations of streamgages with peaks of record and hydrographs for selected gages are shown in illustrations. Record peak flows are documented in a table.
Precipitation
Media

Sources/Usage: Public Domain. View Media Details
Hurricane Irene moved north along the Atlantic Coast, making landfall near Cape Lookout, North Carolina, in the early morning hours on Saturday, August 27, 2011. The hurricane then moved back over open water before making landfall for a second time at Little Egg Inlet, New Jersey, at 0535 hours eastern daylight time Sunday morning, August 28, 2011 (Associated Press, 2011). This is the first time since 1903 that a hurricane made landfall in New Jersey. Light rain began to fall during late morning on Saturday, August 27, in southern New Jersey. Steady, heavier rain developed on Saturday afternoon moving into northern New Jersey by mid-afternoon. Rain continued for about an 18-hour period through Sunday morning. From 6 to 8 inches fell across most of the State. Higher amounts, from 9 inches to as much as 10 inches, were observed at U.S. Geological Survey (USGS) and National Weather Service (NWS) precipitation gages in southwestern, central, and northeastern New Jersey. A National Weather Service map of total observed precipitation for the 24-hour period ending September 28, 2011, at 0800 hours EST (fig. 1) shows the distribution of precipitation from Hurricane Irene across the State.
Precipitation gages operated by the USGS and the NWS recorded total precipitation amounts ranging from 4.2 inches at the USGS gage at Lakewood in Monmouth County (400530074090901) to 10.3 inches at the USGS precipitation gage at Stockton in Hunterdon County (402414074584401). Gages at NWS climate sites at Newark, Trenton, and Atlantic City recorded 8.92 inches, 5.74 inches, and 5.88 inches, respectively. USGS gages recorded from 6.2 to 9.9 inches of rain in the Raritan and Rahway River Basins, 6.5 to 8.6 inches in the Passaic and Hackensack River Basins, 4.3 to 7.9 inches in the Lower Delaware River Basin, 6.0 to 10.3 inches in the Upper Delaware Basin, and 4.2 to 6.7 inches in the southern Atlantic Coastal Plain Basins.
Antecedent Conditions
Media

Sources/Usage: Public Domain. View Media Details
Rainfall in New Jersey during August 1 through August 26, 2011, ranged from 8 inches to more than16 inches, 150 to 600 percent of normal. A band of precipitation ranging from 300 to 600 percent of normal was observed from southwestern through central New Jersey during the 2-week period preceding the hurricane. (fig. 2). Heavy rain associated with a low-pressure system moving northeast along the Atlantic Coast, in general, dropped 4 to 8 inches of rain over most of the State from late Saturday night, August 13, through late Sunday night, August 14, 2011.
Media

Sources/Usage: Public Domain. View Media Details
Precipitation totals were higher than normal in August across the State. August was the wettest month on record in New Jersey since record keeping began in 1895. On average, 16.64 inches fell statewide. This is 12.43 inches greater than the 1981 to 2010 monthly average of 4.21 inches and 4.66 inches more than the second wettest month on record, October 2005. Precipitation recorded at the NWS Philadelphia gage from August 1 through 26 was 13.61 inches, making this the all-time wettest month on record. This breaks the previous monthly record of 13.07 inches set in September 1999 (National Weather Service, 2011a). Despite below-average precipitation in June and July,(U.S. Geological Survey, 2011) the precipitation in August made the summer of 2011 the wettest season on record for New Jersey. Precipitation totaled 23.90 inches for the summer season, which is 4.23 inches more than the previous summer season record of 19.67 inches in 1928 (New Jersey State Climatologist, 2011a).
Peak Flows at Continuous-Record Streamflow–Gaging Stations
New Jersey experienced record flooding at USGS gages during the month of August. Gages on the Cohansey River at Seeley (01412800) and Little Ease Run near Clayton (01411456) registered record peaks on August 14, 2011. The second and third highest peaks of record occurred at other gages in southwestern New Jersey from August 14–16, 2011 (fig. 3). Record peaks were recorded statewide from August 28 to 31 as a result of Hurricane Irene. Thirty-nine of the 94 gages with greater than or equal to 20 years of record, considered long-term gages, registered record high peaks. Another 23 gages recorded the second highest peaks of record, and 7 gages recorded the third highest peaks of record (fig. 4). Statewide thirty-three gages recorded peaks equal to or greater than the 100-year recurrence interval ( < 1.0% annual exceedance probability). Flood peaks for this event, historical peaks of record, and flood frequency statistics for gages throughout the State are listed in table (below).
Media

Sources/Usage: Public Domain. View Media Details
Flood peaks were the highest ever recorded at 13 of the 24 USGS long-term continuous-record discharge gaging stations in the Passaic River Basin. The stations at Passaic River near Millington, NJ (01379000), Wanaque River at Awosting, NJ (01383500), and Ramapo River at Pompton Lakes, NJ (01388000), recorded the highest flood peaks in more than 90 years of record. The peak stages at the Rockaway River above Reservoir at Boonton (01380500) and Ramapo River near Mahwah (01387500) were more than 2 feet higher than the previous peaks of record (fig. 5). The Saddle River at Lodi gage (01391500) recorded the highest peak in 87 years of record (Multimedia - Flooded Gage). Many residential and commercial properties along the Pompton and Ramapo Rivers in the Passaic River Basin were flooded (Multimedia - Recording events after flooding). Many roads throughout the basin were impassable (Multimedia - Car Submerged).
Media

Sources/Usage: Public Domain. View Media Details
In the Raritan River Basin, flood peaks were the highest ever recorded at 8 of the 23 long-term gages. Two of these stations—South Branch Raritan River near High Bridge (01396500) and Millstone River at Blackwells Mills (01402000)—recorded the highest peaks in more than 90 years of record. The peak stage at the Stony Brook at Princeton (01401000) was nearly 2 feet higher than the previous record.
The gage on the Elizabeth River (01393450) and the two gages on the Rahway River at Springfield (01394500) and Rahway (1395000) recorded peaks of record for 89, 73 and 89, years of record, respectively. The peak stage at the Rahway River at Rahway was 2.5 feet higher than the previous peak of record.
Along the Delaware River tributaries north of Trenton, four of the nine long-term gages recorded peaks of record. Records were set at the Musconetcong River at Bloomsbury gage (01445000), the Flat Brook near Flatbrookville gage (01440000), Assunpink Creek at Trenton (01464000), and Pequest River at Huntsville (01445000) which have 94, 88, 88 and 31 years of record respectively. Four more gages on these tributaries recorded the second highest peaks of record. Along tributaries to the Delaware River in the Coastal Plain, 5 of the 14 long-term gages recorded peaks of record. The peak stage at the Crosswicks Creek at Extonville (01464500) was 3.2 feet higher than the previous peak of record (fig. 6). Four other gages on tributaries to the Delaware River in the Coastal Plain recorded the second highest peaks of record.
In the Atlantic coastal drainages, 5 of 14 long-term gages recorded peaks of record. The record peak at the Toms River gage was the highest in 82 years of record (Multimedia - Toms River Flooded gage). Three other gages recorded the second highest peaks of record.
Statewide thirty-three gages recorded peaks greater than the 100-year recurrence interval (< 1.0% annual exceedance probability). Flood frequencies observed during this flood exceeded the 100-year flood frequency at gages in the Hackensack River, Passaic River, Elizabeth River, Raritan River, Manasquan River, Toms River, Maurice River, Rancocas Creek, Cohansey River, Musconetcong River, Raccoon Creek, and Salem River Basins (table below).
Media

Sources/Usage: Public Domain. View Media Details
Gages along the main stem of the Delaware River recorded only 4- to 6-year flood events (17–25% annual exceedance probabilities) during the hurricane. The gages on the Cedar Creek (01409000) and Westecunk Creek (01409280) recorded only 2-year events. The gage on East Branch Bass River near New Gretna (01410150) recorded less than 2-year events (>50-percent annual exceedance probability). The flood frequencies associated with these flood peaks are referenced from Watson and Schopp (2009) and Schopp and Firda (2008) . The flood frequency statistics for this flood are considered provisional and may change upon reanalysis.
The New Jersey Department of Environmental Protection (NJDEP) Bureau of Dam Safety reported the failure of six dams as a result of this storm. Three of these dams are located upstream from USGS gaging stations. Saffrin Pond Dam, failed completely. It is located on Weldon Brook, a tributary to Lake Hopatcong, upstream from the USGS stage-only gage on Lake Hopatcong and the continuous-record streamflow-gaging station on Musconetcong River at the outlet of Lake Hopatcong. The New Jersey No Name # 89 Dam, located on a tributary to Crosswicks Creek in North Hanover Township in Burlington County upstream from the gage on Crosswicks Creek at Extonville, failed completely. The Bureau of Dam Safety also reported damage to the spillway at Cassville Dam, located on a small tributary to the Toms River, upstream from the gage on Toms River near Toms River. Water stored in these impoundments contributed to the flow past these gages during the flood. The portion of the hydrograph contributed by the dam breaches is not distinguishable from the runoff contributed by the rainfall.
The NJDEP Bureau of Dam Safety reported the failure of five dams as a result of the storm on August 14. The Seeley’s Mill Pond Dam located upstream from the Cohansey River at Seeley gaging station failed completely.
Peak Stage at Continuous-Record Tide Gages
Media

Sources/Usage: Public Domain. View Media Details
Peak stage during high tide on Sunday morning, August 28, 2011, was the highest for the period of record at six USGS continuous-record tide-telemetry stations. The five gages with new record high peaks are Passaic River at PVSC at Newark (01392650), Raritan Bay at Keansburg (01407081), Shrewsbury River at Sea Bright (01407600), Shark River at Belmar (01407770), and Manasquan River at Point Pleasant (01408050). The datum of these gages is North American Vertical Datum of 1988. (table below)
The gage at Passaic River at PVSC, at Newark recorded a peak stage of 7.11 feet, 0.64 feet higher than the previous peak of record on March 13, 2010. The gage at Raritan Bay at Keansburg recorded a peak stage of 7.16 feet, 0.15 feet higher than the previous peak of record on March 13, 2010. The gage at Shrewsbury River at Sea Bright recorded a peak stage of 6.29 feet, 0.96 feet higher than the previous peak of record on March 13, 2010 (fig. 11). The gage at Shark River at Belmar recorded a peak stage of 5.98 feet, 0.39 feet higher than the previous peak of record on March 13, 2010. The gage at Manasquan River at Point Pleasant recorded a peak stage of 5.80 feet, 0.93 feet higher than the previous peak of record on March 13, 2010.
The New Jersey Department of Environmental Protection (NJDEP) Bureau of Dam Safety reported the failure of six dams as a result of this storm. Three of these dams are located upstream from USGS gaging stations. Saffrin Pond Dam, failed completely. It is located on Weldon Brook, a tributary to Lake Hopatcong, upstream from the USGS stage-only gage on Lake Hopatcong and the continuous-record streamflow-gaging station on Musconetcong River at the outlet of Lake Hopatcong. The New Jersey No Name # 89 Dam, located on a tributary to Crosswicks Creek in North Hanover Township in Burlington County upstream from the gage on Crosswicks Creek at Extonville, failed completely. The Bureau of Dam Safety also reported damage to the spillway at Cassville Dam, located on a small tributary to the Toms River, upstream from the gage on Toms River near Toms River. Water stored in these impoundments contributed to the flow past these gages during the flood. The portion of the hydrograph contributed by the dam breaches is not distinguishable from the runoff contributed by the rainfall.
Response to the Event
The USGS New Jersey Water Science Center’s Hydrologic Data Assessment Program prepared for field work in response to the forecast of flood conditions the week before the high water occurred. Seven storm-surge sensors were deployed on Friday August 26 at tidal crest-stage gage sites along the coast in support of the USGS national storm-surge monitoring network. These sensors collected continuous water-level data throughout the storm to supplement the 24 long-term continuous-record tide gages along the back bays and tidal rivers along the coast.
Real-time data from USGS gaging stations across New Jersey were invaluable in planning the first line of response to the storm. The real-time data helped USGS personnel focus efforts on the watersheds experiencing the most flooding. Early Sunday morning, August 28, six crews were dispatched to selected gages to make discharge measurements. Two other crews collected water-quality samples on the rising limb of the hydrograph of the Delaware River at Trenton and Raritan River at Bound Brook gages for the USGS National Water Quality Assessment (NAWQA) Program. Sampling continued at these sites during the peak and recession on Monday and Tuesday, August 29–30. Samples were collected for bacteria analysis at six sites along the Passaic River on Wednesday, August 31, and Thursday, September 1.
Six crews continued to make high-water discharge measurements throughout the week. Over seventy-five discharge measurements were made from August 28 through September 2. Discharge measurements were the highest ever made at many long-term gages. Discharge measurements also were the highest ever made at many relatively new gages, defining the upper limb of the hydrograph. Discharge measurements were made at gages on small streams on August 28. Discharge measurements were made August 30–31 at or near the flood peak at gaging stations with drainage from large basins whose stream were slower to crest. Discharge measurements at some of these gages were made on the receding limb of the hydrograph during September 1–2. Photographs of the flooded areas were taken at many gaging stations.
Peak stage exceeded the upper end of the stage/discharge ratings at many gages. Discharge measurements were used to extend stage/discharge ratings at more than 25 stations. High-water marks were flagged for indirect measurements of peak flow at eight gaging stations.
The USGS New Jersey Water Science Center stayed in communication with the U.S. Army Corps of Engineers, New York District; the NWS Mount Holly forecast office; and the NWS Mid-Atlantic River Forecast office during the hurricane. Requests were answered for maximum recordable stages at flood-forecast gages, rating extensions at numerous gages, peak-stage and flow data from gages, comparisons of peaks from this storm with historic peaks, and the flood frequency of the event at various locations. The New Jersey Water Science Center participated in daily conference calls with the USGS National Flood Specialist and personnel at other Water Science Centers about flooding in east coast states. The Federal Emergency Management Agency (FEMA) was contacted by the New Jersey Water Science Center with an offer of assistance with flood-related work. A mission assignment was accepted to document high-water marks at more than 150 locations along streams that experienced record-breaking flooding.
External Citiations:
Associated Press, August 28, 2011, Hurricane Irene makes second landfall in New Jersey packed with rain, accessed September 13, 2011, at
http://www.nola.com/hurricane/index.ssf/2011/08/hurricane_irene_makes_second_l.html.
National Weather Service, 2011a, National Weather Service—Advanced hydrologic prediction service, accessed August 30, 2011, at http://water.weather.gov/precip.
National Weather Service, 2011b, Text product display SXUS71 KPHI 261317, accessed August 27, 2011, at
http://forecast.weather.gov/product.php?site=NWS&issuedby=PHL&product=RER&format=CI&version=1&glossary=0.
New Jersey State Climatologist, 2011, Waterlogged NJ: August 2011 and Summer 2011 Summary, accessed September 12, 2011, at http://climate.rutgers.edu/stateclim/?section=menu&%20target=aug11.
August 27-30, 2011 Flood Peak Table
Table pdf provided upon request
Related
Flooded Gage
Flooding at the streamgaging station on the Saddle River at Lodi, NJ (U.S.Geological Survey station 01391500), after the peak on August 28, 2011.
Related
Flooded Gage
Flooding at the streamgaging station on the Saddle River at Lodi, NJ (U.S.Geological Survey station 01391500), after the peak on August 28, 2011.
Flooding at the streamgaging station on the Saddle River at Lodi, NJ (U.S.Geological Survey station 01391500), after the peak on August 28, 2011.