
Annual NLCD Land Cover Classification
The primary NLCD land cover product represents the predominant thematic land cover class within the mapping year with respect to broad categories of artificial or natural surface cover.
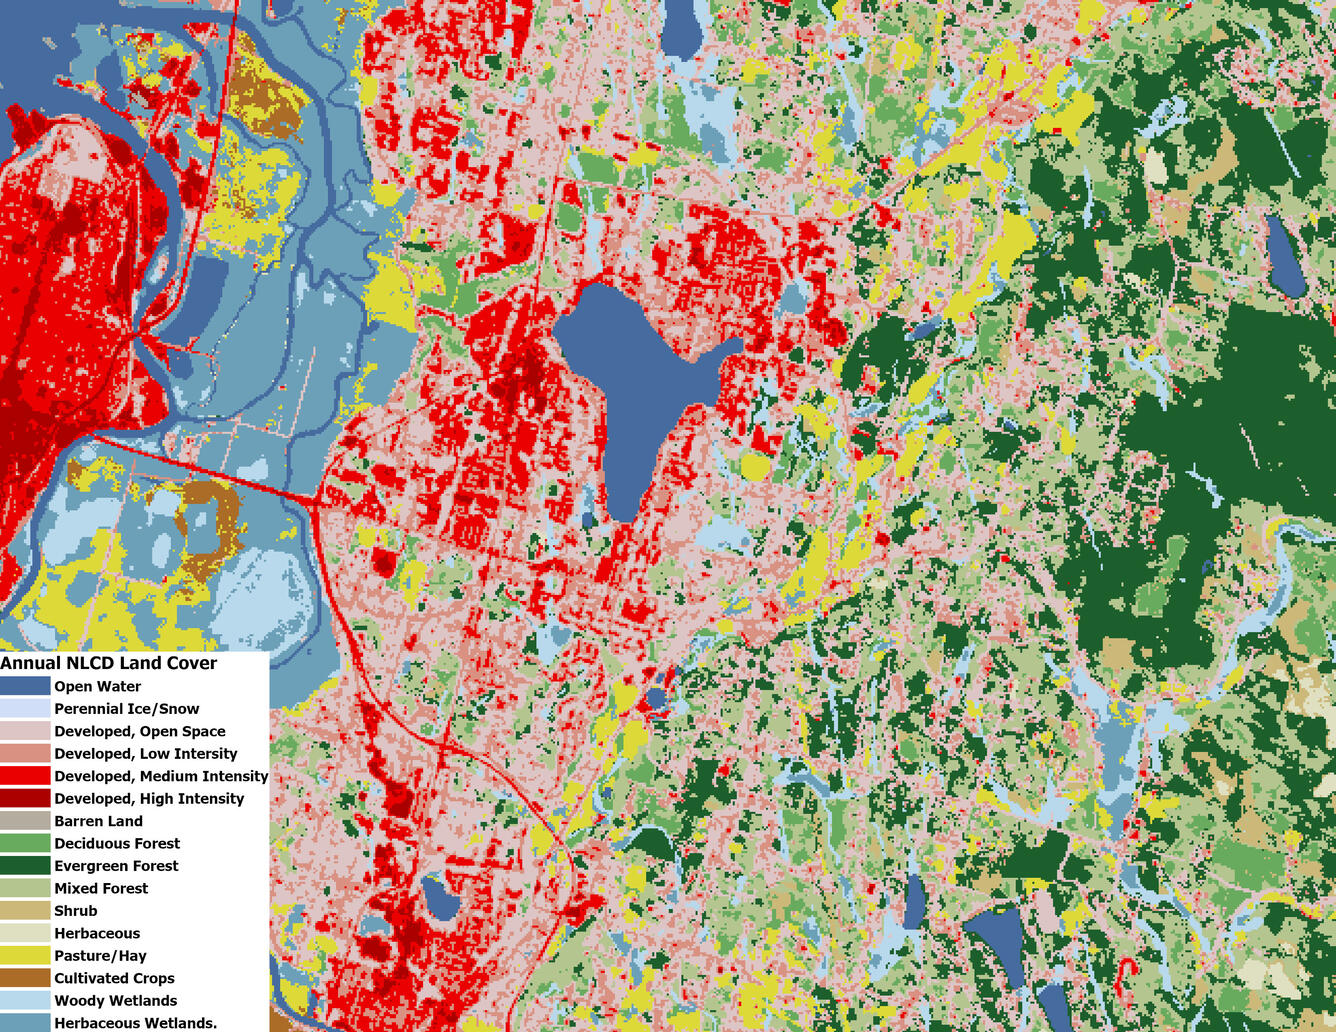
The annual NLCD land cover dataset uses a modified Anderson Level II classification system with 16 land cover classes. This classification system is derived from the original Anderson land use and land cover classification system, which was designed as a compromise among the need for compatibility with existing classification systems across U.S. federal agencies, separability using primarily remote sensing data, and logical, hierarchical relationships among classes (1).
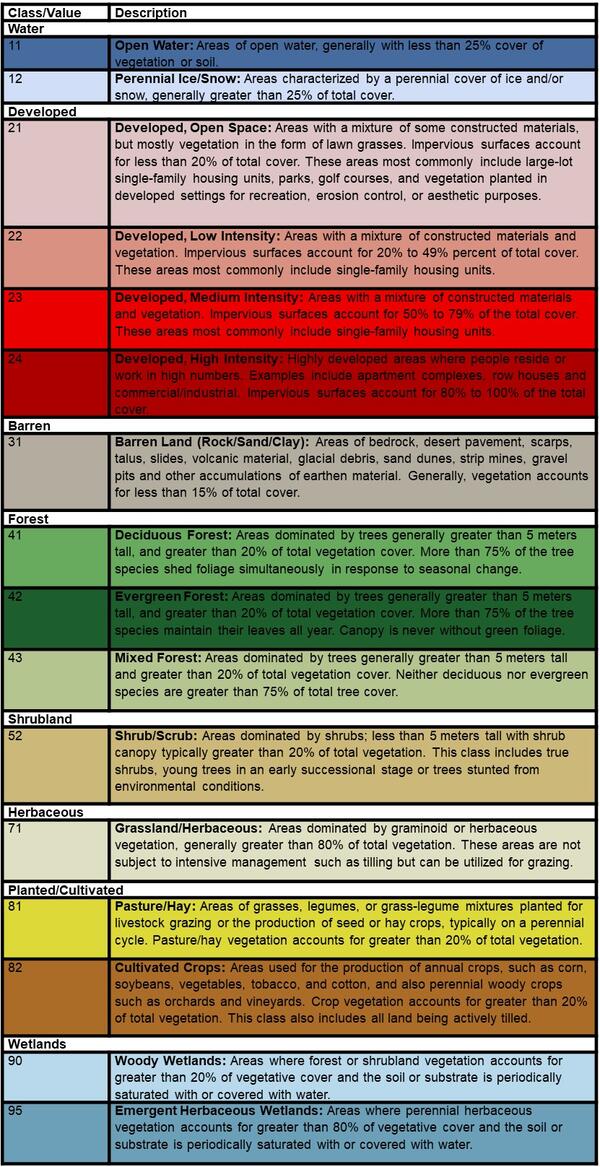
Annual NLCD Land Cover Legend
These classes only include CONUS.
Data Access
Products can be accessed via the data access page.
Documents
Additional information on Annual NLCD methods and science products can be found in the Science User Product Guide.
Annual NLCD Data Citation
Annual NLCD has no restrictions on the use of science products. Annual NLCD does ask that if you use the data as part of a publication or presentation that you use the following citation below; however, it is not a requirement to use the data.
U.S. Geological Survey (USGS), 2024, Annual NLCD Collection 1 Science Products: U.S. Geological Survey data release, https://doi.org/10.5066/P94UXNTS
References
- Anderson, J.R., Hardy, E.E., Roach, J.T., and Witmer, R.E., 1976. A land use and land cover classification system for use with remote sensor data. Professional Paper 964, U.S. Geological Survey, Washington DC, U.S. Government Printing Office. 10.3133/pp964.
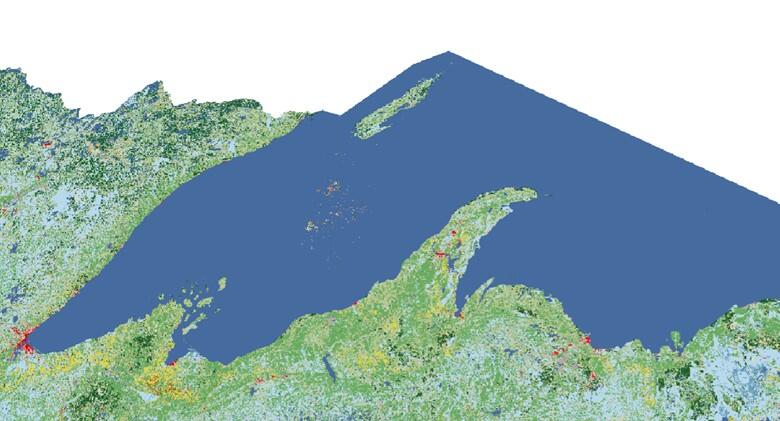
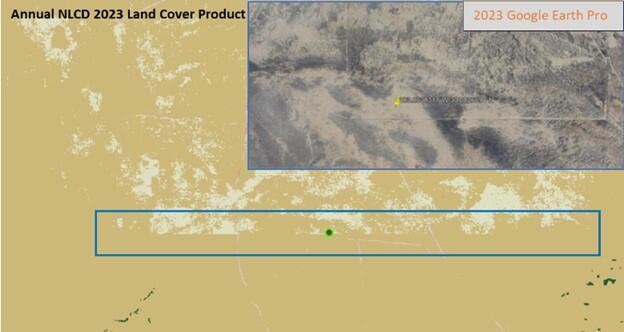
Land Cover Characteristics, Constraints, and Caveats
The following artifacts were discovered in the Land Cover product.
- Water Bodies: Pixelated developed, barren, and other out-of-place land cover calls over water, particularly Lake Superior, are attributed to input issues related to artifacts in the leaf-on/off imagery used.
- Shrubs/Grassland Classification Artifacts: Linear artifacts of “blockiness” can be seen in some geographic areas, particularly the desert Southwest where the new spatial AI/ML approach had difficulty differentiating between shrub/scrub and grassland/herbaceous.
Land cover values are generally associated with an annual July 1st date due to many of the processing steps either centered around that date or use the date explicitly. In this case, spectral change in the second half of the year will be seen in the next year’s land cover
Not all land cover changes are expected to have an associated spectral change. Gradual changes are modeled within the deep learning architecture, and post classification can produce additional cover changes.
Media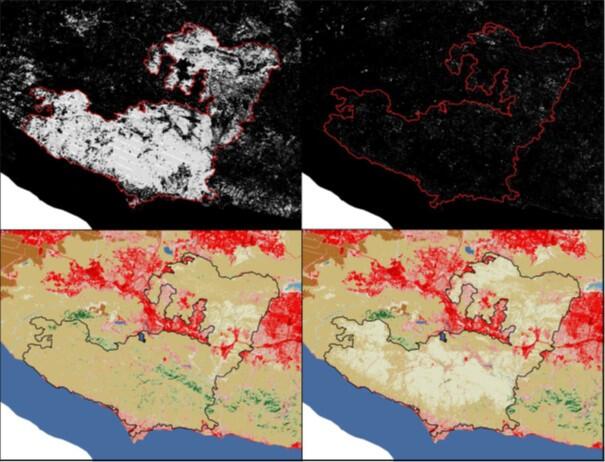 Sources/Usage: Public Domain. View Media Details
Images above show the Woolsey fire that started on November 8th, 2019. The top left image shows the Annual NLCD spectral day change of year product where you can clearly see the Woolsey fire. Top right image displays the lack of disturbance the following year in 2019 using the spectral day of change product. The bottom two images (bottom left 2018, bottom right 2019) show the land cover changes after the Woolsey fire.
Back to the Annual NLCD Product Suite page.
The primary NLCD land cover product represents the predominant thematic land cover class within the mapping year with respect to broad categories of artificial or natural surface cover.
The annual NLCD land cover dataset uses a modified Anderson Level II classification system with 16 land cover classes. This classification system is derived from the original Anderson land use and land cover classification system, which was designed as a compromise among the need for compatibility with existing classification systems across U.S. federal agencies, separability using primarily remote sensing data, and logical, hierarchical relationships among classes (1).
Annual NLCD Land Cover Legend
These classes only include CONUS.
Data Access
Products can be accessed via the data access page.
Documents
Additional information on Annual NLCD methods and science products can be found in the Science User Product Guide.
Annual NLCD Data Citation
Annual NLCD has no restrictions on the use of science products. Annual NLCD does ask that if you use the data as part of a publication or presentation that you use the following citation below; however, it is not a requirement to use the data.
U.S. Geological Survey (USGS), 2024, Annual NLCD Collection 1 Science Products: U.S. Geological Survey data release, https://doi.org/10.5066/P94UXNTS
References
- Anderson, J.R., Hardy, E.E., Roach, J.T., and Witmer, R.E., 1976. A land use and land cover classification system for use with remote sensor data. Professional Paper 964, U.S. Geological Survey, Washington DC, U.S. Government Printing Office. 10.3133/pp964.
Land Cover Characteristics, Constraints, and Caveats
The following artifacts were discovered in the Land Cover product.
- Water Bodies: Pixelated developed, barren, and other out-of-place land cover calls over water, particularly Lake Superior, are attributed to input issues related to artifacts in the leaf-on/off imagery used.
- Shrubs/Grassland Classification Artifacts: Linear artifacts of “blockiness” can be seen in some geographic areas, particularly the desert Southwest where the new spatial AI/ML approach had difficulty differentiating between shrub/scrub and grassland/herbaceous.
Land cover values are generally associated with an annual July 1st date due to many of the processing steps either centered around that date or use the date explicitly. In this case, spectral change in the second half of the year will be seen in the next year’s land cover
Not all land cover changes are expected to have an associated spectral change. Gradual changes are modeled within the deep learning architecture, and post classification can produce additional cover changes.
Media
Sources/Usage: Public Domain. View Media DetailsImages above show the Woolsey fire that started on November 8th, 2019. The top left image shows the Annual NLCD spectral day change of year product where you can clearly see the Woolsey fire. Top right image displays the lack of disturbance the following year in 2019 using the spectral day of change product. The bottom two images (bottom left 2018, bottom right 2019) show the land cover changes after the Woolsey fire.
Back to the Annual NLCD Product Suite page.