
Effects of Soil Health Best Management Practices on Water‐Quality and Soil-Moisture in Soldier Creek, Nemaha County Kansas
In October 2020, The U.S. Geological Survey, in cooperation with the Kansas Department of Health and Environment (KDHE), began long‐term in‐stream monitoring downstream from the headwaters of Soldier Creek, a KDHE identified basin with a high probability of large‐scale implementation (more than 50% of area) of soil health best management practices (BPMs) to quantify potential changes in streamflow, sediment, nutrients, pesticides, bacteria, and macroinvertebrate communities. Analysis of long-term effects of soil health BMPs on flow, water‐quality, and soil-moisture within the Soldier Creek headwaters study area basin will increase the national body of hydrologic scientific knowledge and enable extrapolation of findings across similar landscapes. The study will continuously measure stream stage, streamflow, temperature, specific conductance, pH, dissolved oxygen, nitrate, turbidity; sample for nutrients, sediment, and pesticides; monitor bacteria and macroinvertebrates, monitor precipitation, temperature, humidity, barometric pressure, wind speed and direction, and solar radiation; and measure soil moisture, and temperature at in soils with and without implementation of BMPs.
OVERVIEW:
In October 2020, The U.S. Geological Survey (USGS), in cooperation with the Kansas Department of Health and Environment (KDHE), began long‐term in‐stream monitoring in the headwaters of Soldier Creek, a 5,915-acre basin KDHE identified as having a high probability of large‐scale implementation (more than 50% of area) of soil health best management practices (BMPs) to quantify potential changes in streamflow, sediment, nutrients, pesticides, bacteria, and macroinvertebrate communities (fig. 1). In July 2023, USGS and KDHE decided to add long-term soil moisture monitoring beginning in March 2024 to measure potential changes in soil moisture and soil temperature to the study. By collecting, analyzing, and interpreting stream water‐quality data downstream of soil health BMPs and soil-moisture measurements in locations with and without implemented soil-health BMPs within the study area basin for a period of more than 10 years, USGS and KDHE will increase the national body of hydrologic scientific knowledge and enable extrapolation of findings across similar landscapes.

Agricultural production is the most widespread human‐induced change to the continental U.S. landscape over the past 150 years and has accelerated surface erosion, altered natural stream forms, and contributed to excess sediment, nutrients, and pesticides in streams (Broussard and Turner, 2009). Conventional agricultural practices (tillage, overgrazing, monoculture, and lack of plant cover) have decreased recharge, increased soil temperatures and moisture loss, and reduced nutrient uptake (USDA‐NRCS, 2020). Nonpoint source pollution is the largest cause of water‐ quality impairment in the United States (U.S. Environmental Protection Agency, 1996). Throughout most of the U.S., including Kansas, nonpoint source runoff from agricultural land use is the dominant factor affecting water quality of streams and lakes (Falcone and others, 2019; U.S. Environmental Protection Agency, 2017; Turner and Rabelais, 2004; U.S. Geological Survey, 1999). Soil health BMPs improve soil properties impacted by conventional agricultural practices by reducing soil disturbance, increasing biodiversity, maintaining soil cover, and maintaining continuous plant growth through reduced tillage, prevention of overgrazing, increasing the diversity of plants and soil biota with crop rotation, maintaining living roots all year, keeping soil covered with cover drops increasing water infiltration and soil moisture, reducing soil temperature and reducing runoff (USDA‐NRCS, 2023b). This study will help answer the question “What is the effectiveness of implemented soil health best management practices at a watershed scale on water-quality and soil moisture?”.
Science Partnership Opportunity:
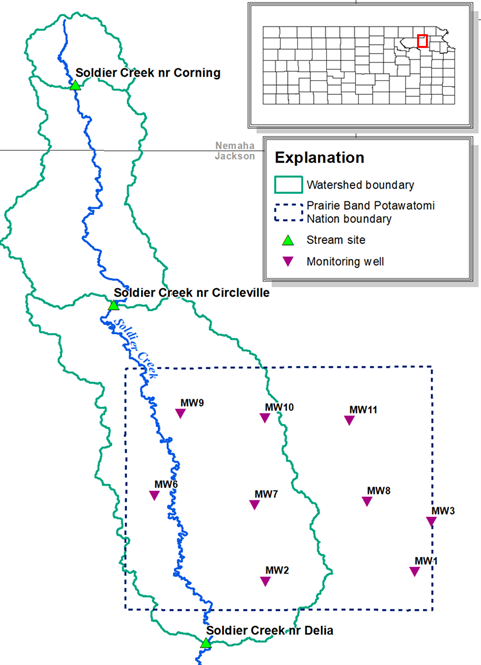
The USGS-KDHE Soldier Creek study and the downstream USGS-Prairie Band Potawatomi Nation study (fig 2) will both benefit from the data collected by each study in Soldier Creek. These studies are being conducted at the same time and are sampling and monitoring similar water-quality constituents in Soldier Creek. Although the questions that will be addressed by each study are different, the opportunity to combine the data from both studies will enhance the results for each.
Study Details:
The study site was selected in collaboration with KDHE based on knowledge regarding the high probability that soil health BMPs would be implemented by the landowners within the basin. A streamgage, Soldier Creek nr Corning KS streamflow gage (USGS site ID 06889110), was installed and began recording stage on June 22, 2021, at the downstream edge of the study site. A stage‐discharge relationship will be developed after stage and discharge are concurrently measured over the range of expected streamflows to compute continuous discharge (fig. 1). Streamflow is required to compute mass transport of nutrients and sediment and assess changes in nutrient and sediment loading to streams over time. The USGS, is also continuously measuring real‐time water quality parameters (temperature, specific conductance, pH, dissolved oxygen, nitrate, and turbidity). In March 2024, continuous monitoring will begin for precipitation, temperature, humidity, barometric pressure, wind speed and direction, and soil moisture and soil temperature within the study area at selected depths from land surface to 100 cm in soils with and without soil-health BMPs implemented. All continuous data are collected at 5‐ to 15-minute intervals and made available in real‐time on the internet through the USGS National Water Information System (NWIS; https://waterdata.usgs.gov/nwis).
At the streamgage/water‐quality monitoring site, water‐quality samples [nutrients (total and dissolved forms of nitrogen and phosphorus), suspended‐sediment, total suspended solids, pesticides, and additional quality‐assurance replicate and blank samples] are being collected over a range of streamflows for each year of the study. KDHE is monitoring bacteria and macroinvertebrates in Soldier Creek. An automatic sampler was installed to help ensure samples are collected during high streamflows of short duration.
Results of sample analyses for nutrients, sediment, and pesticides at the Soldier Creek nr Corning KS streamflow gage (USGS site ID 06889110), will be used to develop nutrient and suspended sediment surrogate models after the required number of discrete samples are collected over the range of hydrologic conditions. The models will be published on the USGS National Real‐time Water Quality (NRTWQ) website for Kansas and allow analysis of constituents that are not directly measured in real‐ time by sensors. Additionally, these models allow computation of nutrient and sediment loads and yields.
Analyses of streamflow, water quality and soil moisture collected during the study, and of historical water‐quality samples collected by USGS and KDHE will be used to help characterize pre‐BMP implementation streamflow, water quality and differences in soil-moisture content in soils with implemented soil-health BMPs and those without. Data quality will be assessed for all data sets used for analysis to allow accurate comparison of study results and help to achieve common research goals.
The rationale for types of data collection and sample analysis, specific constituents for sample analysis, and the annual and monthly water-quality sampling schedules, locations of historical data collected by USGS and KDHE are shown below.
Rationale for data collection and sample analysis:
|
Parameters collected by discrete sampling |
|
|
Parameter |
Reason |
|
Stream discharge |
A measure of the volume flow rate of a river or stream. When linked with a concurrent stage value, can be used to develop a “stage‐discharge” rating for continuous computations of discharge. Required to establish the hydrologic conditions, potentially examine baseflow vs overland flow characteristics, and to compute flux, mass transport. |
|
Nutrients Check to add dissolved and totals |
Key parameter being measured, nitrogen and phosphorus in their various forms (bound to particles and dissolved) are applied directly to fields, and when in aquatic systems, are essential to growth and survival of living organisms. If in excess in aquatic systems, can cause excessive growth of algae leading to reduced dissolved oxygen and disrupting of food webs. Change in concentrations will be used to assess effects of implementation of soil health BMPs |
|
Pesticides |
Pesticides are applied directly to fields and may be detrimental to growth and survival of living organisms if in aquatic systems. |
|
Suspended‐Sediment Concentration Total Suspended Solids |
Suspended‐sediment concentration is the amount of eroded sediment present in an aquatic system. Sources of sediment include stream banks, stream bottoms, and terrestrial sources. Suspended‐sediment concentration is generally higher during storm events, and lower during baseflow. Excessive suspended‐ sediment concentrations from accelerated erosion is considered a major pollutant in the United States. |
|
Bacteria |
Changes with respect to in‐stream bacteria counts may indicate the influence of altering land‐use to support livestock and grazing. Incorporating grazing of cover crops is a common recommendation for implementing soil health BMPs and measuring bacteria levels will assess this potential impact on stream water quality. |
|
Macroinvertebrate bioassessment |
Assess changes in overall in‐stream nutrient levels using annual changes in macroinvertebrate tolerance scores developed based on nutrient pollution levels. |
|
Parameters collected by real‐time sensors |
|
|
Parameter |
Reason |
|
Stream Stage |
A measurement of water level above an established datum. Required for real‐time computations of discharge (see ‘Stream Discharge’ above). |
|
Temperature |
Temperature is a physical factor that controls both chemical (solubility) and biological (respiration, photosynthesis) processes in water. |
|
Specific Conductance |
A measure of salinity, specific conductance is typically an explanatory variable for nutrients in aquatic systems. |
|
pH |
The measure of acidity or alkalinity in an aquatic system, natural levels in Kansas are typically between 7 and 9. |
|
Dissolved Oxygen |
Dissolved oxygen is the amount of oxygen present in water. Aquatic systems receive dissolved oxygen from the atmosphere and from aquatic plants performing photosynthesis. It is used in the computations of stream metabolism. |
|
Turbidity |
Turbidity is a measure of the optical clarity of water. In Kansas, it is typically an explanatory variable for suspended‐sediment concentration. |
|
Nitrate |
The dissolved form of the nutrient nitrogen can be measured by its effect on the absorbance of ultraviolet light. Measuring this nutrient in real‐time allows for insights into diurnal processes not normally observed through traditional nutrient characterization methods. |
|
Meteorological data (rainfall, temperature, pressure, humidity, wind speed/direction, solar radiation) |
Measurements required to assess impact of BMPs on soil moisture, soil temperature, and evapotranspiration. |
|
Volumetric water content and soil temperature |
Measurement of volumetric water content and temperature of soils at nine depths (5, 10, 20, 30, 40, 50, 60, 75, and 100 cm) allows for determining how soil health BMPs effect the ability of soils to infiltrate water from rainfall and the resulting effect on soil temperature. |
Constituents for sample analysis:
|
Analyte |
Parameter Code |
Method |
CAS # |
Detection Limit |
Reporting Limit |
Units |
|
Nutrients: NWQL Schedule 535 [Nutrients + Microkjeldahl P and N]: |
||||||
|
P, Phosphorus, FCC |
666 |
KJ005 |
7723-14-0 |
0.02 |
0.04 |
mg/L |
|
Phosphorus as P, WCA |
665 |
KJ009 |
7723-14-0 |
0.02 |
0.04 |
mg/L |
|
Ammonia + organic nitrogen, as N, filtered |
623 |
KJ002 |
17778-88-0 |
0.07 |
0.14 |
mg/L |
|
Ammonia + organic nitrogen as N, unf, acidified |
625 |
KJ008 |
17778-88-0 |
0.07 |
0.14 |
mg/L |
|
Ammonia, Kone |
608 |
SHC02 |
7664-41-7 |
0.02 |
0.04 |
mg/L |
|
Nitrite, Kone |
613 |
DZ001 |
14797-65-0 |
0.001 |
0.002 |
mg/L |
|
ortho-PO4, Kone |
671 |
PHM01 |
14265-44-2 |
0.004 |
0.008 |
mg/L |
|
NO2 + NO3, as N, Kone |
631 |
RED01 |
0.04 |
0.08 |
mg/L |
|
|
Pesticides: NWQL Schedule 2001 - Pesticides, Water, Filtered, SPE-C18, Lab Extracted: |
||||||
|
1RS cis-Permethrin |
82687 |
GCM35 |
61949-76-6 |
0.006 |
0.012 |
ug/L |
|
2,6-Diethylaniline |
82660 |
GCM35 |
579-66-8 |
0.001 |
0.008 |
ug/L |
|
2-Chloro-4-isopropylamino-6-amino-s-triazine |
4040 |
GCM35 |
6190-65-4 |
0.007 |
0.014 |
ug/L |
|
Acetochlor |
49260 |
GCM33 |
34256-82-1 |
0.005 |
0.01 |
ug/L |
|
Alachlor |
46342 |
GCM35 |
15972-60-8 |
0.004 |
0.008 |
ug/L |
|
Atrazine |
39632 |
GCM35 |
1912-24-9 |
0.004 |
0.008 |
ug/L |
|
Azinphos-methyl |
82686 |
GCM35 |
86-50-0 |
0.03 |
0.06 |
ug/L |
|
Benfluralin |
82673 |
GCM35 |
1861-40-1 |
0.007 |
0.014 |
ug/L |
|
Butylate |
4028 |
GCM35 |
2008-41-5 |
0.004 |
0.008 |
ug/L |
|
Carbaryl |
82680 |
GCM35 |
63-25-2 |
0.03 |
0.06 |
ug/L |
|
Carbofuran |
82674 |
GCM35 |
1563-66-2 |
0.03 |
0.06 |
ug/L |
|
Chlorpyrifos |
38933 |
GCM35 |
2921-88-2 |
0.005 |
0.01 |
ug/L |
|
Cyanazine |
4041 |
GCM35 |
21725-46-2 |
0.011 |
0.022 |
ug/L |
|
Dacthal (DCPA) |
82682 |
GCM35 |
1861-32-1 |
0.001 |
0.008 |
ug/L |
|
Desulfinylfipronil |
62170 |
GCM31 |
|
0.006 |
0.012 |
ug/L |
|
Desulfinylfipronil amide |
62169 |
GCM31 |
|
0.015 |
0.029 |
ug/L |
|
Diazinon |
39572 |
GCM35 |
333-41-5 |
0.004 |
0.008 |
ug/L |
|
Diazinon-d10 (surrogate) |
91063 |
GCM35 |
100155-47-3 |
|
|
pct |
|
Dieldrin |
39381 |
GCM35 |
60-57-1 |
0.006 |
0.012 |
ug/L |
|
Disulfoton |
82677 |
GCM35 |
298-04-4 |
0.02 |
0.04 |
ug/L |
|
EPTC |
82668 |
GCM35 |
759-94-4 |
0.001 |
0.008 |
ug/L |
|
Ethalfluralin |
82663 |
GCM35 |
55283-68-6 |
0.004 |
0.008 |
ug/L |
|
Ethoprophos |
82672 |
GCM35 |
13194-48-4 |
0.008 |
0.016 |
ug/L |
|
Fipronil |
62166 |
GCM31 |
120068-37-3 |
0.009 |
0.018 |
ug/L |
|
Fipronil sulfide |
62167 |
GCM31 |
120067-83-6 |
0.008 |
0.016 |
ug/L |
|
Fipronil sulfone |
62168 |
GCM31 |
120068-36-2 |
0.012 |
0.024 |
ug/L |
|
Fonofos |
4095 |
GCM35 |
944-22-9 |
0.004 |
0.008 |
ug/L |
|
Linuron |
82666 |
GCM35 |
330-55-2 |
0.03 |
0.06 |
ug/L |
|
Malathion |
39532 |
GCM35 |
121-75-5 |
0.018 |
0.036 |
ug/L |
|
Methyl parathion |
82667 |
GCM35 |
298-00-0 |
0.004 |
0.008 |
ug/L |
|
Metolachlor |
39415 |
GCM35 |
51218-45-2 |
0.006 |
0.012 |
ug/L |
|
Metribuzin |
82630 |
GCM35 |
21087-64-9 |
0.01 |
0.02 |
ug/L |
|
Molinate |
82671 |
GCM35 |
2212-67-1 |
0.008 |
0.016 |
ug/L |
|
Napropamide |
82684 |
GCM35 |
15299-99-7 |
0.005 |
0.01 |
ug/L |
|
Parathion |
39542 |
GCM35 |
56-38-2 |
0.01 |
0.02 |
ug/L |
|
Pebulate |
82669 |
GCM35 |
1114-71-2 |
0.008 |
0.016 |
ug/L |
|
Pendimethalin |
82683 |
GCM35 |
40487-42-1 |
0.014 |
0.028 |
ug/L |
|
Phorate |
82664 |
GCM35 |
298-02-2 |
0.01 |
0.02 |
ug/L |
|
Prometon |
4037 |
GCM35 |
1610-18-0 |
0.006 |
0.012 |
ug/L |
|
Propachlor |
4024 |
GCM35 |
1918-16-7 |
0.004 |
0.008 |
ug/L |
|
Propanil |
82679 |
GCM35 |
709-98-8 |
0.005 |
0.01 |
ug/L |
|
Propargite |
82685 |
GCM35 |
2312-35-8 |
0.01 |
0.02 |
ug/L |
|
Propyzamide |
82676 |
GCM35 |
23950-58-5 |
0.004 |
0.008 |
ug/L |
|
Simazine |
4035 |
GCM35 |
122-34-9 |
0.004 |
0.008 |
ug/L |
|
Tebuthiuron |
82670 |
GCM35 |
34014-18-1 |
0.08 |
0.16 |
ug/L |
|
Terbacil |
82665 |
GCM35 |
5902-51-2 |
0.012 |
0.024 |
ug/L |
|
Terbufos |
82675 |
GCM35 |
13071-79-9 |
0.009 |
0.018 |
ug/L |
|
Thiobencarb |
82681 |
GCM35 |
28249-77-6 |
0.008 |
0.016 |
ug/L |
|
Triallate |
82678 |
GCM35 |
2303-17-5 |
0.002 |
0.008 |
ug/L |
|
Trifluralin |
82661 |
GCM35 |
1582-09-8 |
0.009 |
0.018 |
ug/L |
|
alpha-HCH |
34253 |
GCM35 |
319-84-6 |
0.001 |
0.008 |
ug/L |
|
alpha-HCH-d6 (surrogate) |
91065 |
GCM35 |
86194-41-4 |
|
|
pct |
|
gamma-HCH (Lindane) |
39341 |
GCM35 |
58-89-9 |
0.004 |
0.008 |
ug/L |
|
p,p'-DDE |
34653 |
GCM35 |
72-55-9 |
0.009 |
0.018 |
ug/L |
|
Total Suspended Solids: |
||||||
|
ROE AT 105 DEG C SUS |
530 |
SLD04 |
|
|
15 |
mg/L |
|
Turbidity: |
||||||
|
Turbidity, NTRU |
63676 |
TS098 |
|
|
2 |
NTRU |
|
Suspended Sediment: |
||||||
|
Suspended Sediment concentration |
|
|
|
|
0.1 |
mg/L |
Annual water-quality sampling schedule:
|
State Fiscal Year (July 1 – June 30) |
**2021 |
2022 |
2023 |
2024 |
2025 |
2026 |
2027 |
2028 |
|
Nutrients |
0 |
10 |
16 |
8 |
8 |
8 |
8 |
8 |
|
Nutrient QA/QC Blank and replicate |
0 |
0 |
2 |
2 |
2 |
2 |
2 |
2 |
|
Suspended Sediment |
0 |
10 |
16 |
8 |
8 |
8 |
8 |
8 |
|
Total Suspended Solids |
0 |
0 |
0 |
8 |
8 |
8 |
8 |
8 |
|
Suspended Sediment, Total Suspended Solids Replicate for each |
0 |
0 |
0 |
1 |
1 |
1 |
1 |
1 |
|
Pesticides |
0 |
2 |
4 |
4 |
4 |
4 |
4 |
4 |
|
Pesticide QA/QC Blank, replicate, (spike every other year) |
0 |
0 |
2 |
3 |
2 |
3 |
2 |
3 |
Monthly sampling schedule:
|
State Fiscal Year |
Jul |
Aug |
Sep |
Oct |
Nov |
Dec |
Jan |
Feb |
Mar |
Apr |
May |
Jun |
|
|
2024-2028 |
Nutrients, Sediment |
1 |
1 |
1 |
|
1 |
|
1 |
|
|
1 |
1 |
1 |
|
Pesticides |
|
1 |
|
1 |
|
|
|
|
|
1 |
|
1 |
|
USGS and KDHE site locations and existing sources of water-quality and streamflow information:
|
USGS Streamgages |
|
|
06889100 SOLDIER C NR GOFF, KS |
|
|
Begin date: |
1964‐03‐01 |
|
End date: |
1987‐06‐30 |
|
06889120 SOLDIER C NR BANCROFT, KS |
|
|
Begin date: |
1964‐03‐01 |
|
End date: |
1988‐06‐30 |
|
06889140 SOLDIER C NR SOLDIER, KS |
|
|
Begin date: |
1964‐03‐01 |
|
End date: |
1998‐09‐30 |
|
06889160 SOLDIER C NR CIRCLEVILLE, KS |
|
|
Begin date: |
1964‐03‐02 |
|
End date: |
2001‐03‐31 |
KDHE Water-Quality Sampling Sites
|
FID |
79 |
|
SITE_NAME |
SC296 |
|
PROGM_CODE |
SC |
|
PROGM_TEXT |
Stream Monitoring Network |
|
SOURCE_NAM |
Soldier Creek near Goff |
|
WTSOURCE |
STREAM/RIVER |
|
USE_TEXT |
Other |
|
FEATURE_TY |
SAMPLING POINT |
|
SITE_STATU |
Inactive |
|
SUR_REGIST |
N |
|
HAB |
N |
|
COUNTY |
NEMAHA |
|
HUC12 |
102701020801 |
|
SITE_COMME |
|
|
LOC_DESC |
County Road Bridge, 3.3 miles southwest of Goff |
|
LATITUDE |
39.624153 |
|
LONGITUDE |
‐95.966637 |
|
COLLECT_ME |
ArcGIS ‐ DOQ |
|
COLLECT_DA |
6/22/1990 |
|
COLLECT_BY |
BUTLER, M. |
|
CREATED_US |
GIS |
|
CREATED_DA |
4/28/2017 |
|
LAST_EDITE |
GIS |
|
LAST_EDI_1 |
10/28/2019 SITE_STA_1 |
|
SC297 |
|
|
FID |
80 |
|
SITE_NAME |
SC297 |
|
PROGM_CODE |
SC |
|
PROGM_TEXT |
Stream Monitoring Network |
|
SOURCE_NAM |
Soldier Creek near Bancroft |
|
WTSOURCE |
STREAM/RIVER |
|
USE_TEXT |
Other |
|
FEATURE_TY |
SAMPLING POINT |
|
SITE_STATU |
Inactive |
|
SUR_REGIST |
N |
|
HAB |
N |
|
COUNTY |
NEMAHA |
|
HUC12 |
102701020801 |
|
SITE_COMME |
|
|
LOC_DESC |
County Road Bridge, 1.0 mile south and 3.75 miles west of Bancroft |
|
LATITUDE |
39.595045 |
|
LONGITUDE |
‐95.973555 |
|
COLLECT_ME |
ArcGIS ‐ DOQ |
|
COLLECT_DA |
6/22/1990 |
|
COLLECT_BY |
BUTLER, M. |
|
CREATED_US |
GIS |
|
CREATED_DA |
4/28/2017 |
|
LAST_EDITE |
GIS |
|
LAST_EDI_1 |
10/28/2019 SITE_STA_1 |
|
SC298 |
|
|
FID |
328 |
|
SITE_NAME |
SC298 |
|
PROGM_CODE |
SC |
|
PROGM_TEXT |
Stream Monitoring Network |
|
SOURCE_NAM |
Soldier Creek near Soldier |
|
WTSOURCE |
STREAM/RIVER |
|
USE_TEXT |
Other |
|
FEATURE_TY |
SAMPLING POINT |
|
SITE_STATU |
Inactive |
|
SUR_REGIST |
N |
|
HAB |
N |
|
COUNTY |
NEMAHA |
|
HUC12 |
102701020801 |
|
SITE_COMME |
|
|
LOC_DESC |
K‐62 Highway Bridge, 2.0 miles north of Soldier |
|
LATITUDE |
39.56011 |
|
LONGITUDE |
‐95.962934 |
|
COLLECT_ME |
ArcGIS ‐ DOQ |
|
COLLECT_DA |
6/22/1990 |
|
COLLECT_BY |
BUTLER, M. |
|
CREATED_US |
GIS |
|
CREATED_DA |
4/28/2017 |
|
LAST_EDITE |
GIS |
|
LAST_EDI_1 |
10/28/2019 |
|
SITE_STA_1 |
|
|
SC299 |
|
|
FID |
329 |
|
SITE_NAME |
SC299 |
|
PROGM_CODE |
SC |
|
PROGM_TEXT |
Stream Monitoring Network |
|
SOURCE_NAM |
Soldier Creek near Circleville |
|
WTSOURCE |
STREAM/RIVER |
|
USE_TEXT |
Other |
|
FEATURE_TY |
SAMPLING POINT |
|
SITE_STATU |
Inactive |
|
SUR_REGIST |
N |
|
HAB |
N |
|
COUNTY |
NEMAHA |
|
HUC12 |
102701020802 |
|
SITE_COMME |
|
|
LOC_DESC |
K‐16 Highway Bridge, 3.0 miles south and 5.5 miles west of Circleville |
|
LATITUDE |
39.46321 |
|
LONGITUDE |
‐95.94988 |
|
COLLECT_ME |
GPS ‐ unknown type |
|
COLLECT_DA |
6/22/1990 |
|
COLLECT_BY |
BUTLER, M. |
|
CREATED_US |
GIS |
|
CREATED_DA |
4/28/2017 |
|
LAST_EDITE |
GIS |
|
LAST_EDI_1 |
10/28/2019 SITE_STA_1 |
Continuous Water Quality Data
A continuous water‐quality monitor was installed to collect water temperature, specific conductance, dissolved oxygen, pH, turbidity, and nitrate. Real‐time water‐quality monitors provide the smallest amount of uncertainty with respect to changes in concentration over time for each monitored constituent when combined with discrete samples. These data quantify stream physical (temperature and turbidity), chemical (specific conductance, pH, nitrate, and biological (dissolved oxygen) conditions. These data are collected at 5‐ to 15‐minute intervals and made available in real‐time on the internet via the USGS National Water Information System (NWIS; https://waterdata.usgs.gov/nwis) at the following link Soldier Creek NR Corning, KS - USGS Water Data for the Nation.
Surrogate Models
Regression models allow for further real‐time computations of constituents of interest that are not directly measured by in‐stream sensors. For this study suspended sediment, total suspended solids, and nutrients are of interest. Suspended sediment and total suspended solids models typically require a minimum of 36 samples to be collected over at least a two‐year period, and over the range of expected streamflows to create statistically valid regression models for suspended sediment using turbidity (Rasmussen and others, 2009). Nutrient concentrations likely are more variable in Soldier Creek and models may require more samples (a minimum of 48 samples are proposed) to characterize that variability to create statistically valid regression model of nutrients using a nitrate sensor.
Surrogate models may also be developed for other constituents of interest. These computed values will be available on the web through NRTWQ (https://nrtwq.usgs.gov/ks/) at the USGS National Real‐time Water Quality (NRTWQ) website for Kansas. A minimum of 8 samples per year will be collected beginning in year 2024 of the study. These samples will be used for model development by 2025 and after model development to confirm model performance. Models will be updated periodically as new data are acquired.
Weather and Soil Moisture Data
Weather data and volumetric soil-water content will be measured continuously at one or more locations within the study area beginning in March 2024. One site location (fig 1) has been selected and additional sites will be determined in consultation with KDHE partners and agricultural producers in the basin. Soils within the study area are predominantly clay loam and silty clay loam. The soil at the selected site is Pawnee clay loam (4 to 8 percent slopes, eroded) and represents 42.7% of the study area basin (USDA‐NRCS, 2023a). Relative effects of soil health BMPs will be assessed by comparing measured weather data to trends for soil moisture, soil temperature, and evapotranspiration in soils with and without implementation of BMPs. These measurements will be available on the internet through the NWIS; https://waterdata.usgs.gov/nwis.
Stream Bacteria and Macroinvertebrates:
KDHE will sample for bacteria (E. coli) weekly to bi-weekly at the study site during the contact recreation season (April 1 – Oct 31) and will coordinate with USGS to collect bacteria during USGS water-quality sampling events. KDHE will perform macroinvertebrate bioassessment annually in the spring in collaboration with USGS to assess annual changes in macroinvertebrate tolerance scores develop based on nutrient pollution levels as described in Stone and others (2012) as well as metrics developed by the state of Kansas.
Land Use:
KDHE will also provide land use assessments and surveys of the study area over the course of the study to allow comparison of land-use changes with changes in stream water-quality. Understanding these processes will help characterize fertilizer application effects on stream ecosystem health and function over the period of study. From these data, a comprehensive analysis will be conducted by USGS to characterize water‐quality and sediment trends as they relate to soil health applications within the basin and the effects on soil moisture, soil temperature and evapotranspiration in soils with and without implementation of BMPs. This analysis will include historical comparisons where those data exist. Samples and data will be collected by USGS staff at each sampling site.
Products:
Continuous and discrete streamflow, water‐quality, sediment, meteorologic, soil moisture, and soil temperature data, USGS approved sediment and nutrient surrogate models, presentations, and outreach. Publication of a USGS Scientific Investigations Report and Fact Sheet using data collected through 2028 will be determined based on inspection of the data and in consultation with the KDHE.
Issues and Potential Limitations:
Best Management Practices are land management practices that improve terrestrial or water quality. Measuring potential effects of agricultural BMP on stream‐water quality presents several challenges and it can be difficult to correlate BMP implementation with changes in stream water‐quality (U.S. Environmental Protection Agency, 1997). Cooperative partners (landowners) will need to agree on roles and responsibilities to ensure effects of BMP implementation are quantifiable. Efforts to adopt BMPs by agricultural producers are based on landowner willingness to participate in programs that provide payment to implement one of a large selection of approved BMPs and are not implemented systematically. As such, this results in a diffuse spatial distribution of any single BMP type over a range of soil and land use types as well as BMP implementations that may be applied over varying periods of time. Programs that assist landowners with BMP implementation often do not disclose implementation locations as part of the landowner agreement. Nondisclosure may increase landowner participation, but limits focused investigation into BMP effectiveness on in‐stream water quality. For this study, KDHE will provide information regarding BMP implementation position on the landscape. Studies likely require a complete inventory of BMP implementation across an entire watershed or geographic area to document for evaluating nonpoint source control measures (U.S. Environmental Protection Agency, 1997).
Resultant nutrient load reductions from BMP implementation may be unobservable. For example, if 25 percent of a watershed’s land area has implemented one BMP designed to reduce nutrient loads to streams by 10%, the overall in‐stream change would be a decrease of 2.5% (assuming the BMP is fully effective and other land use practices in the watershed have remained constant).
Given that loads are calculated as streamflow multiplied by concentration to yield a mass per unit of time and that streamflow measurements typically are within 5 to 10 percent of actual streamflow, the 2.5% change may not be detectable in calculated annual loads because the change is less than the associated streamflow error.
Water‐quality improvements from BMP implementation may not be evident because of lag time (the time elapsed between the implementation and the detection of measurable improvement in water‐quality; Meals and others, 2010) and concomitant BMP efforts in the watershed. Hydrology, vegetation growth, transport rate and path, hydraulic residence time, pollutant sorption properties, and ecosystem linkages are important processes that influence lag time (Meals and others, 2010).
Continuous water‐quality probes exist for nitrate but not for dissolved phosphorus. Current technology for measuring continuous dissolved phosphorus make use of a “wet chemistry” field unit that pumps water from a stream or lake and processes the sample with consumable reagents to determine and record phosphorus concentrations at the desired interval. These units are labor intensive to operate and do not work in the highly turbid waters in Kansas streams. This study may provide an ideal opportunity to highlight the need for dissolved phosphorus probes nationally.
References:
Broussard, W., and Turner, R.E., 2009, A century of changing land‐use and water quality relationships in the continental U.S.: Frontiers in Ecology and Environment, v. 7, no. 6, p. 302–307.
Falcone, J.A., Murphy, J.C., and Sprague, L.A., 2019. Regional patterns of anthropogenic influences on streams and rivers in the conterminous United States, from the early 1970s to 2012: Journal of Land Use Science, v. 13, no. 6, p. 585–614, https://doi.org/10.1080/1747423X.2019.1590473.
Meals, D.W., Dressing, S.A., and Davenport, T.E., 2010, Lag time in water quality response to best management practices: a review: Journal of Environmental Quality, v. 31, no. 1, p. 85–96, https://pdfs.semanticscholar.org/aab9/6b90bc9d48349b8fb6ca0c4fbf4cc6458….
Rasmussen, P.P., Gray, J.R., Glysson, G.D., and Ziegler, A.C., 2009, Guidelines and procedures for computing timeseries suspended‐sediment concentrations and loads from in‐stream turbidity‐ sensor and streamflow data: U.S. Geological Survey Techniques and Methods, book 3, chap. C4, 52 p. https://pubs.usgs.gov/tm/tm3c4/pdf/TM3C4.pdf
Stone, M.L., Rasmussen, T.J., Bennett, T.J., Poulton, B.C., and Ziegler, A.C., 2012, Protocols for collection of streamflow, water‐quality, streambed‐sediment, periphyton, macroinvertebrate, fish, and habitat data to describe stream quality for the Hydrobiological Monitoring
Program, Equus Beds Aquifer Storage and Recovery Program, city of Wichita, Kansas: U.S. Geological Survey Open‐File Report 2012–1055, 55 p.
Turner, R.E., and Rabelais, N.N., 2004, Suspended sediment, C, N, P, and Si yields from the Mississippi River Basin: Hydrobiologia v. 511, p. 78–89.
USDA‐NRCS. 2023a. Web Soil Survey. USDA‐NRCS. https://websoilsurvey.nrcs.usda.gov/app/WebSoilSurvey.aspx (accessed 25 Apr. 2023).
USDA‐NRCS. 2023b. Soil health. USDA‐NRCS. https://www.nrcs.usda.gov/wps/portal/nrcs/main/soils/health/ (accessed 29 Mar.2023).
U.S. Environmental Protection Agency, 1996, Nonpoint source pollution: the Nation’s largest water quality problem: Washington D.C., U.S. Environmental Protection Agency, Office of Water, EPA 841‐F‐96‐004A, 2 p., https://nepis.epa.gov/Exe/ZyPDF.cgi/20004PZG.PDF?Dockey=20004PZG.PDF.
U.S. Environmental Protection Agency, 1997, Techniques for tracking, evaluating, and reporting the implementation of nonpoint source control measures I. Agriculture: Washington D.C., U.S. Environmental Protection Agency, Office of Water, EPA 841‐B‐97‐010, variously paged, https://www.epa.gov/sites/production/files/2015‐09/documents/2000_01_04_nps_agfinal‐ 2.pdf.
U.S. Environmental Protection Agency, 2017, National water quality inventory: report to Congress: Washington D.C., U.S. Environmental Protection Agency, Office of Water, EPA 841‐R‐16‐011, 21 p., https://www.epa.gov/sites/production/files/2017‐ 12/documents/305brtc_finalowow_08302017.pdf.
U.S. Geological Survey, 1999, The quality of our nation’s waters—Nutrients and pesticides: U.S. Geological Survey Circular 1225, 82 p., https://pubs.usgs.gov/circ/circ1225/pdf/front.pdf

Surface Water and Groundwater Availability and Quality in the Prairie Band Potawatomi Nation Reservation
In October 2020, The U.S. Geological Survey, in cooperation with the Kansas Department of Health and Environment (KDHE), began long‐term in‐stream monitoring downstream from the headwaters of Soldier Creek, a KDHE identified basin with a high probability of large‐scale implementation (more than 50% of area) of soil health best management practices (BPMs) to quantify potential changes in streamflow, sediment, nutrients, pesticides, bacteria, and macroinvertebrate communities. Analysis of long-term effects of soil health BMPs on flow, water‐quality, and soil-moisture within the Soldier Creek headwaters study area basin will increase the national body of hydrologic scientific knowledge and enable extrapolation of findings across similar landscapes. The study will continuously measure stream stage, streamflow, temperature, specific conductance, pH, dissolved oxygen, nitrate, turbidity; sample for nutrients, sediment, and pesticides; monitor bacteria and macroinvertebrates, monitor precipitation, temperature, humidity, barometric pressure, wind speed and direction, and solar radiation; and measure soil moisture, and temperature at in soils with and without implementation of BMPs.
OVERVIEW:
In October 2020, The U.S. Geological Survey (USGS), in cooperation with the Kansas Department of Health and Environment (KDHE), began long‐term in‐stream monitoring in the headwaters of Soldier Creek, a 5,915-acre basin KDHE identified as having a high probability of large‐scale implementation (more than 50% of area) of soil health best management practices (BMPs) to quantify potential changes in streamflow, sediment, nutrients, pesticides, bacteria, and macroinvertebrate communities (fig. 1). In July 2023, USGS and KDHE decided to add long-term soil moisture monitoring beginning in March 2024 to measure potential changes in soil moisture and soil temperature to the study. By collecting, analyzing, and interpreting stream water‐quality data downstream of soil health BMPs and soil-moisture measurements in locations with and without implemented soil-health BMPs within the study area basin for a period of more than 10 years, USGS and KDHE will increase the national body of hydrologic scientific knowledge and enable extrapolation of findings across similar landscapes.
Agricultural production is the most widespread human‐induced change to the continental U.S. landscape over the past 150 years and has accelerated surface erosion, altered natural stream forms, and contributed to excess sediment, nutrients, and pesticides in streams (Broussard and Turner, 2009). Conventional agricultural practices (tillage, overgrazing, monoculture, and lack of plant cover) have decreased recharge, increased soil temperatures and moisture loss, and reduced nutrient uptake (USDA‐NRCS, 2020). Nonpoint source pollution is the largest cause of water‐ quality impairment in the United States (U.S. Environmental Protection Agency, 1996). Throughout most of the U.S., including Kansas, nonpoint source runoff from agricultural land use is the dominant factor affecting water quality of streams and lakes (Falcone and others, 2019; U.S. Environmental Protection Agency, 2017; Turner and Rabelais, 2004; U.S. Geological Survey, 1999). Soil health BMPs improve soil properties impacted by conventional agricultural practices by reducing soil disturbance, increasing biodiversity, maintaining soil cover, and maintaining continuous plant growth through reduced tillage, prevention of overgrazing, increasing the diversity of plants and soil biota with crop rotation, maintaining living roots all year, keeping soil covered with cover drops increasing water infiltration and soil moisture, reducing soil temperature and reducing runoff (USDA‐NRCS, 2023b). This study will help answer the question “What is the effectiveness of implemented soil health best management practices at a watershed scale on water-quality and soil moisture?”.
Science Partnership Opportunity:
The USGS-KDHE Soldier Creek study and the downstream USGS-Prairie Band Potawatomi Nation study (fig 2) will both benefit from the data collected by each study in Soldier Creek. These studies are being conducted at the same time and are sampling and monitoring similar water-quality constituents in Soldier Creek. Although the questions that will be addressed by each study are different, the opportunity to combine the data from both studies will enhance the results for each.
Study Details:
The study site was selected in collaboration with KDHE based on knowledge regarding the high probability that soil health BMPs would be implemented by the landowners within the basin. A streamgage, Soldier Creek nr Corning KS streamflow gage (USGS site ID 06889110), was installed and began recording stage on June 22, 2021, at the downstream edge of the study site. A stage‐discharge relationship will be developed after stage and discharge are concurrently measured over the range of expected streamflows to compute continuous discharge (fig. 1). Streamflow is required to compute mass transport of nutrients and sediment and assess changes in nutrient and sediment loading to streams over time. The USGS, is also continuously measuring real‐time water quality parameters (temperature, specific conductance, pH, dissolved oxygen, nitrate, and turbidity). In March 2024, continuous monitoring will begin for precipitation, temperature, humidity, barometric pressure, wind speed and direction, and soil moisture and soil temperature within the study area at selected depths from land surface to 100 cm in soils with and without soil-health BMPs implemented. All continuous data are collected at 5‐ to 15-minute intervals and made available in real‐time on the internet through the USGS National Water Information System (NWIS; https://waterdata.usgs.gov/nwis).
At the streamgage/water‐quality monitoring site, water‐quality samples [nutrients (total and dissolved forms of nitrogen and phosphorus), suspended‐sediment, total suspended solids, pesticides, and additional quality‐assurance replicate and blank samples] are being collected over a range of streamflows for each year of the study. KDHE is monitoring bacteria and macroinvertebrates in Soldier Creek. An automatic sampler was installed to help ensure samples are collected during high streamflows of short duration.
Results of sample analyses for nutrients, sediment, and pesticides at the Soldier Creek nr Corning KS streamflow gage (USGS site ID 06889110), will be used to develop nutrient and suspended sediment surrogate models after the required number of discrete samples are collected over the range of hydrologic conditions. The models will be published on the USGS National Real‐time Water Quality (NRTWQ) website for Kansas and allow analysis of constituents that are not directly measured in real‐ time by sensors. Additionally, these models allow computation of nutrient and sediment loads and yields.
Analyses of streamflow, water quality and soil moisture collected during the study, and of historical water‐quality samples collected by USGS and KDHE will be used to help characterize pre‐BMP implementation streamflow, water quality and differences in soil-moisture content in soils with implemented soil-health BMPs and those without. Data quality will be assessed for all data sets used for analysis to allow accurate comparison of study results and help to achieve common research goals.
The rationale for types of data collection and sample analysis, specific constituents for sample analysis, and the annual and monthly water-quality sampling schedules, locations of historical data collected by USGS and KDHE are shown below.
Rationale for data collection and sample analysis:
|
Parameters collected by discrete sampling |
|
|
Parameter |
Reason |
|
Stream discharge |
A measure of the volume flow rate of a river or stream. When linked with a concurrent stage value, can be used to develop a “stage‐discharge” rating for continuous computations of discharge. Required to establish the hydrologic conditions, potentially examine baseflow vs overland flow characteristics, and to compute flux, mass transport. |
|
Nutrients Check to add dissolved and totals |
Key parameter being measured, nitrogen and phosphorus in their various forms (bound to particles and dissolved) are applied directly to fields, and when in aquatic systems, are essential to growth and survival of living organisms. If in excess in aquatic systems, can cause excessive growth of algae leading to reduced dissolved oxygen and disrupting of food webs. Change in concentrations will be used to assess effects of implementation of soil health BMPs |
|
Pesticides |
Pesticides are applied directly to fields and may be detrimental to growth and survival of living organisms if in aquatic systems. |
|
Suspended‐Sediment Concentration Total Suspended Solids |
Suspended‐sediment concentration is the amount of eroded sediment present in an aquatic system. Sources of sediment include stream banks, stream bottoms, and terrestrial sources. Suspended‐sediment concentration is generally higher during storm events, and lower during baseflow. Excessive suspended‐ sediment concentrations from accelerated erosion is considered a major pollutant in the United States. |
|
Bacteria |
Changes with respect to in‐stream bacteria counts may indicate the influence of altering land‐use to support livestock and grazing. Incorporating grazing of cover crops is a common recommendation for implementing soil health BMPs and measuring bacteria levels will assess this potential impact on stream water quality. |
|
Macroinvertebrate bioassessment |
Assess changes in overall in‐stream nutrient levels using annual changes in macroinvertebrate tolerance scores developed based on nutrient pollution levels. |
|
Parameters collected by real‐time sensors |
|
|
Parameter |
Reason |
|
Stream Stage |
A measurement of water level above an established datum. Required for real‐time computations of discharge (see ‘Stream Discharge’ above). |
|
Temperature |
Temperature is a physical factor that controls both chemical (solubility) and biological (respiration, photosynthesis) processes in water. |
|
Specific Conductance |
A measure of salinity, specific conductance is typically an explanatory variable for nutrients in aquatic systems. |
|
pH |
The measure of acidity or alkalinity in an aquatic system, natural levels in Kansas are typically between 7 and 9. |
|
Dissolved Oxygen |
Dissolved oxygen is the amount of oxygen present in water. Aquatic systems receive dissolved oxygen from the atmosphere and from aquatic plants performing photosynthesis. It is used in the computations of stream metabolism. |
|
Turbidity |
Turbidity is a measure of the optical clarity of water. In Kansas, it is typically an explanatory variable for suspended‐sediment concentration. |
|
Nitrate |
The dissolved form of the nutrient nitrogen can be measured by its effect on the absorbance of ultraviolet light. Measuring this nutrient in real‐time allows for insights into diurnal processes not normally observed through traditional nutrient characterization methods. |
|
Meteorological data (rainfall, temperature, pressure, humidity, wind speed/direction, solar radiation) |
Measurements required to assess impact of BMPs on soil moisture, soil temperature, and evapotranspiration. |
|
Volumetric water content and soil temperature |
Measurement of volumetric water content and temperature of soils at nine depths (5, 10, 20, 30, 40, 50, 60, 75, and 100 cm) allows for determining how soil health BMPs effect the ability of soils to infiltrate water from rainfall and the resulting effect on soil temperature. |
Constituents for sample analysis:
|
Analyte |
Parameter Code |
Method |
CAS # |
Detection Limit |
Reporting Limit |
Units |
|
Nutrients: NWQL Schedule 535 [Nutrients + Microkjeldahl P and N]: |
||||||
|
P, Phosphorus, FCC |
666 |
KJ005 |
7723-14-0 |
0.02 |
0.04 |
mg/L |
|
Phosphorus as P, WCA |
665 |
KJ009 |
7723-14-0 |
0.02 |
0.04 |
mg/L |
|
Ammonia + organic nitrogen, as N, filtered |
623 |
KJ002 |
17778-88-0 |
0.07 |
0.14 |
mg/L |
|
Ammonia + organic nitrogen as N, unf, acidified |
625 |
KJ008 |
17778-88-0 |
0.07 |
0.14 |
mg/L |
|
Ammonia, Kone |
608 |
SHC02 |
7664-41-7 |
0.02 |
0.04 |
mg/L |
|
Nitrite, Kone |
613 |
DZ001 |
14797-65-0 |
0.001 |
0.002 |
mg/L |
|
ortho-PO4, Kone |
671 |
PHM01 |
14265-44-2 |
0.004 |
0.008 |
mg/L |
|
NO2 + NO3, as N, Kone |
631 |
RED01 |
0.04 |
0.08 |
mg/L |
|
|
Pesticides: NWQL Schedule 2001 - Pesticides, Water, Filtered, SPE-C18, Lab Extracted: |
||||||
|
1RS cis-Permethrin |
82687 |
GCM35 |
61949-76-6 |
0.006 |
0.012 |
ug/L |
|
2,6-Diethylaniline |
82660 |
GCM35 |
579-66-8 |
0.001 |
0.008 |
ug/L |
|
2-Chloro-4-isopropylamino-6-amino-s-triazine |
4040 |
GCM35 |
6190-65-4 |
0.007 |
0.014 |
ug/L |
|
Acetochlor |
49260 |
GCM33 |
34256-82-1 |
0.005 |
0.01 |
ug/L |
|
Alachlor |
46342 |
GCM35 |
15972-60-8 |
0.004 |
0.008 |
ug/L |
|
Atrazine |
39632 |
GCM35 |
1912-24-9 |
0.004 |
0.008 |
ug/L |
|
Azinphos-methyl |
82686 |
GCM35 |
86-50-0 |
0.03 |
0.06 |
ug/L |
|
Benfluralin |
82673 |
GCM35 |
1861-40-1 |
0.007 |
0.014 |
ug/L |
|
Butylate |
4028 |
GCM35 |
2008-41-5 |
0.004 |
0.008 |
ug/L |
|
Carbaryl |
82680 |
GCM35 |
63-25-2 |
0.03 |
0.06 |
ug/L |
|
Carbofuran |
82674 |
GCM35 |
1563-66-2 |
0.03 |
0.06 |
ug/L |
|
Chlorpyrifos |
38933 |
GCM35 |
2921-88-2 |
0.005 |
0.01 |
ug/L |
|
Cyanazine |
4041 |
GCM35 |
21725-46-2 |
0.011 |
0.022 |
ug/L |
|
Dacthal (DCPA) |
82682 |
GCM35 |
1861-32-1 |
0.001 |
0.008 |
ug/L |
|
Desulfinylfipronil |
62170 |
GCM31 |
|
0.006 |
0.012 |
ug/L |
|
Desulfinylfipronil amide |
62169 |
GCM31 |
|
0.015 |
0.029 |
ug/L |
|
Diazinon |
39572 |
GCM35 |
333-41-5 |
0.004 |
0.008 |
ug/L |
|
Diazinon-d10 (surrogate) |
91063 |
GCM35 |
100155-47-3 |
|
|
pct |
|
Dieldrin |
39381 |
GCM35 |
60-57-1 |
0.006 |
0.012 |
ug/L |
|
Disulfoton |
82677 |
GCM35 |
298-04-4 |
0.02 |
0.04 |
ug/L |
|
EPTC |
82668 |
GCM35 |
759-94-4 |
0.001 |
0.008 |
ug/L |
|
Ethalfluralin |
82663 |
GCM35 |
55283-68-6 |
0.004 |
0.008 |
ug/L |
|
Ethoprophos |
82672 |
GCM35 |
13194-48-4 |
0.008 |
0.016 |
ug/L |
|
Fipronil |
62166 |
GCM31 |
120068-37-3 |
0.009 |
0.018 |
ug/L |
|
Fipronil sulfide |
62167 |
GCM31 |
120067-83-6 |
0.008 |
0.016 |
ug/L |
|
Fipronil sulfone |
62168 |
GCM31 |
120068-36-2 |
0.012 |
0.024 |
ug/L |
|
Fonofos |
4095 |
GCM35 |
944-22-9 |
0.004 |
0.008 |
ug/L |
|
Linuron |
82666 |
GCM35 |
330-55-2 |
0.03 |
0.06 |
ug/L |
|
Malathion |
39532 |
GCM35 |
121-75-5 |
0.018 |
0.036 |
ug/L |
|
Methyl parathion |
82667 |
GCM35 |
298-00-0 |
0.004 |
0.008 |
ug/L |
|
Metolachlor |
39415 |
GCM35 |
51218-45-2 |
0.006 |
0.012 |
ug/L |
|
Metribuzin |
82630 |
GCM35 |
21087-64-9 |
0.01 |
0.02 |
ug/L |
|
Molinate |
82671 |
GCM35 |
2212-67-1 |
0.008 |
0.016 |
ug/L |
|
Napropamide |
82684 |
GCM35 |
15299-99-7 |
0.005 |
0.01 |
ug/L |
|
Parathion |
39542 |
GCM35 |
56-38-2 |
0.01 |
0.02 |
ug/L |
|
Pebulate |
82669 |
GCM35 |
1114-71-2 |
0.008 |
0.016 |
ug/L |
|
Pendimethalin |
82683 |
GCM35 |
40487-42-1 |
0.014 |
0.028 |
ug/L |
|
Phorate |
82664 |
GCM35 |
298-02-2 |
0.01 |
0.02 |
ug/L |
|
Prometon |
4037 |
GCM35 |
1610-18-0 |
0.006 |
0.012 |
ug/L |
|
Propachlor |
4024 |
GCM35 |
1918-16-7 |
0.004 |
0.008 |
ug/L |
|
Propanil |
82679 |
GCM35 |
709-98-8 |
0.005 |
0.01 |
ug/L |
|
Propargite |
82685 |
GCM35 |
2312-35-8 |
0.01 |
0.02 |
ug/L |
|
Propyzamide |
82676 |
GCM35 |
23950-58-5 |
0.004 |
0.008 |
ug/L |
|
Simazine |
4035 |
GCM35 |
122-34-9 |
0.004 |
0.008 |
ug/L |
|
Tebuthiuron |
82670 |
GCM35 |
34014-18-1 |
0.08 |
0.16 |
ug/L |
|
Terbacil |
82665 |
GCM35 |
5902-51-2 |
0.012 |
0.024 |
ug/L |
|
Terbufos |
82675 |
GCM35 |
13071-79-9 |
0.009 |
0.018 |
ug/L |
|
Thiobencarb |
82681 |
GCM35 |
28249-77-6 |
0.008 |
0.016 |
ug/L |
|
Triallate |
82678 |
GCM35 |
2303-17-5 |
0.002 |
0.008 |
ug/L |
|
Trifluralin |
82661 |
GCM35 |
1582-09-8 |
0.009 |
0.018 |
ug/L |
|
alpha-HCH |
34253 |
GCM35 |
319-84-6 |
0.001 |
0.008 |
ug/L |
|
alpha-HCH-d6 (surrogate) |
91065 |
GCM35 |
86194-41-4 |
|
|
pct |
|
gamma-HCH (Lindane) |
39341 |
GCM35 |
58-89-9 |
0.004 |
0.008 |
ug/L |
|
p,p'-DDE |
34653 |
GCM35 |
72-55-9 |
0.009 |
0.018 |
ug/L |
|
Total Suspended Solids: |
||||||
|
ROE AT 105 DEG C SUS |
530 |
SLD04 |
|
|
15 |
mg/L |
|
Turbidity: |
||||||
|
Turbidity, NTRU |
63676 |
TS098 |
|
|
2 |
NTRU |
|
Suspended Sediment: |
||||||
|
Suspended Sediment concentration |
|
|
|
|
0.1 |
mg/L |
Annual water-quality sampling schedule:
|
State Fiscal Year (July 1 – June 30) |
**2021 |
2022 |
2023 |
2024 |
2025 |
2026 |
2027 |
2028 |
|
Nutrients |
0 |
10 |
16 |
8 |
8 |
8 |
8 |
8 |
|
Nutrient QA/QC Blank and replicate |
0 |
0 |
2 |
2 |
2 |
2 |
2 |
2 |
|
Suspended Sediment |
0 |
10 |
16 |
8 |
8 |
8 |
8 |
8 |
|
Total Suspended Solids |
0 |
0 |
0 |
8 |
8 |
8 |
8 |
8 |
|
Suspended Sediment, Total Suspended Solids Replicate for each |
0 |
0 |
0 |
1 |
1 |
1 |
1 |
1 |
|
Pesticides |
0 |
2 |
4 |
4 |
4 |
4 |
4 |
4 |
|
Pesticide QA/QC Blank, replicate, (spike every other year) |
0 |
0 |
2 |
3 |
2 |
3 |
2 |
3 |
Monthly sampling schedule:
|
State Fiscal Year |
Jul |
Aug |
Sep |
Oct |
Nov |
Dec |
Jan |
Feb |
Mar |
Apr |
May |
Jun |
|
|
2024-2028 |
Nutrients, Sediment |
1 |
1 |
1 |
|
1 |
|
1 |
|
|
1 |
1 |
1 |
|
Pesticides |
|
1 |
|
1 |
|
|
|
|
|
1 |
|
1 |
|
USGS and KDHE site locations and existing sources of water-quality and streamflow information:
|
USGS Streamgages |
|
|
06889100 SOLDIER C NR GOFF, KS |
|
|
Begin date: |
1964‐03‐01 |
|
End date: |
1987‐06‐30 |
|
06889120 SOLDIER C NR BANCROFT, KS |
|
|
Begin date: |
1964‐03‐01 |
|
End date: |
1988‐06‐30 |
|
06889140 SOLDIER C NR SOLDIER, KS |
|
|
Begin date: |
1964‐03‐01 |
|
End date: |
1998‐09‐30 |
|
06889160 SOLDIER C NR CIRCLEVILLE, KS |
|
|
Begin date: |
1964‐03‐02 |
|
End date: |
2001‐03‐31 |
KDHE Water-Quality Sampling Sites
|
FID |
79 |
|
SITE_NAME |
SC296 |
|
PROGM_CODE |
SC |
|
PROGM_TEXT |
Stream Monitoring Network |
|
SOURCE_NAM |
Soldier Creek near Goff |
|
WTSOURCE |
STREAM/RIVER |
|
USE_TEXT |
Other |
|
FEATURE_TY |
SAMPLING POINT |
|
SITE_STATU |
Inactive |
|
SUR_REGIST |
N |
|
HAB |
N |
|
COUNTY |
NEMAHA |
|
HUC12 |
102701020801 |
|
SITE_COMME |
|
|
LOC_DESC |
County Road Bridge, 3.3 miles southwest of Goff |
|
LATITUDE |
39.624153 |
|
LONGITUDE |
‐95.966637 |
|
COLLECT_ME |
ArcGIS ‐ DOQ |
|
COLLECT_DA |
6/22/1990 |
|
COLLECT_BY |
BUTLER, M. |
|
CREATED_US |
GIS |
|
CREATED_DA |
4/28/2017 |
|
LAST_EDITE |
GIS |
|
LAST_EDI_1 |
10/28/2019 SITE_STA_1 |
|
SC297 |
|
|
FID |
80 |
|
SITE_NAME |
SC297 |
|
PROGM_CODE |
SC |
|
PROGM_TEXT |
Stream Monitoring Network |
|
SOURCE_NAM |
Soldier Creek near Bancroft |
|
WTSOURCE |
STREAM/RIVER |
|
USE_TEXT |
Other |
|
FEATURE_TY |
SAMPLING POINT |
|
SITE_STATU |
Inactive |
|
SUR_REGIST |
N |
|
HAB |
N |
|
COUNTY |
NEMAHA |
|
HUC12 |
102701020801 |
|
SITE_COMME |
|
|
LOC_DESC |
County Road Bridge, 1.0 mile south and 3.75 miles west of Bancroft |
|
LATITUDE |
39.595045 |
|
LONGITUDE |
‐95.973555 |
|
COLLECT_ME |
ArcGIS ‐ DOQ |
|
COLLECT_DA |
6/22/1990 |
|
COLLECT_BY |
BUTLER, M. |
|
CREATED_US |
GIS |
|
CREATED_DA |
4/28/2017 |
|
LAST_EDITE |
GIS |
|
LAST_EDI_1 |
10/28/2019 SITE_STA_1 |
|
SC298 |
|
|
FID |
328 |
|
SITE_NAME |
SC298 |
|
PROGM_CODE |
SC |
|
PROGM_TEXT |
Stream Monitoring Network |
|
SOURCE_NAM |
Soldier Creek near Soldier |
|
WTSOURCE |
STREAM/RIVER |
|
USE_TEXT |
Other |
|
FEATURE_TY |
SAMPLING POINT |
|
SITE_STATU |
Inactive |
|
SUR_REGIST |
N |
|
HAB |
N |
|
COUNTY |
NEMAHA |
|
HUC12 |
102701020801 |
|
SITE_COMME |
|
|
LOC_DESC |
K‐62 Highway Bridge, 2.0 miles north of Soldier |
|
LATITUDE |
39.56011 |
|
LONGITUDE |
‐95.962934 |
|
COLLECT_ME |
ArcGIS ‐ DOQ |
|
COLLECT_DA |
6/22/1990 |
|
COLLECT_BY |
BUTLER, M. |
|
CREATED_US |
GIS |
|
CREATED_DA |
4/28/2017 |
|
LAST_EDITE |
GIS |
|
LAST_EDI_1 |
10/28/2019 |
|
SITE_STA_1 |
|
|
SC299 |
|
|
FID |
329 |
|
SITE_NAME |
SC299 |
|
PROGM_CODE |
SC |
|
PROGM_TEXT |
Stream Monitoring Network |
|
SOURCE_NAM |
Soldier Creek near Circleville |
|
WTSOURCE |
STREAM/RIVER |
|
USE_TEXT |
Other |
|
FEATURE_TY |
SAMPLING POINT |
|
SITE_STATU |
Inactive |
|
SUR_REGIST |
N |
|
HAB |
N |
|
COUNTY |
NEMAHA |
|
HUC12 |
102701020802 |
|
SITE_COMME |
|
|
LOC_DESC |
K‐16 Highway Bridge, 3.0 miles south and 5.5 miles west of Circleville |
|
LATITUDE |
39.46321 |
|
LONGITUDE |
‐95.94988 |
|
COLLECT_ME |
GPS ‐ unknown type |
|
COLLECT_DA |
6/22/1990 |
|
COLLECT_BY |
BUTLER, M. |
|
CREATED_US |
GIS |
|
CREATED_DA |
4/28/2017 |
|
LAST_EDITE |
GIS |
|
LAST_EDI_1 |
10/28/2019 SITE_STA_1 |
Continuous Water Quality Data
A continuous water‐quality monitor was installed to collect water temperature, specific conductance, dissolved oxygen, pH, turbidity, and nitrate. Real‐time water‐quality monitors provide the smallest amount of uncertainty with respect to changes in concentration over time for each monitored constituent when combined with discrete samples. These data quantify stream physical (temperature and turbidity), chemical (specific conductance, pH, nitrate, and biological (dissolved oxygen) conditions. These data are collected at 5‐ to 15‐minute intervals and made available in real‐time on the internet via the USGS National Water Information System (NWIS; https://waterdata.usgs.gov/nwis) at the following link Soldier Creek NR Corning, KS - USGS Water Data for the Nation.
Surrogate Models
Regression models allow for further real‐time computations of constituents of interest that are not directly measured by in‐stream sensors. For this study suspended sediment, total suspended solids, and nutrients are of interest. Suspended sediment and total suspended solids models typically require a minimum of 36 samples to be collected over at least a two‐year period, and over the range of expected streamflows to create statistically valid regression models for suspended sediment using turbidity (Rasmussen and others, 2009). Nutrient concentrations likely are more variable in Soldier Creek and models may require more samples (a minimum of 48 samples are proposed) to characterize that variability to create statistically valid regression model of nutrients using a nitrate sensor.
Surrogate models may also be developed for other constituents of interest. These computed values will be available on the web through NRTWQ (https://nrtwq.usgs.gov/ks/) at the USGS National Real‐time Water Quality (NRTWQ) website for Kansas. A minimum of 8 samples per year will be collected beginning in year 2024 of the study. These samples will be used for model development by 2025 and after model development to confirm model performance. Models will be updated periodically as new data are acquired.
Weather and Soil Moisture Data
Weather data and volumetric soil-water content will be measured continuously at one or more locations within the study area beginning in March 2024. One site location (fig 1) has been selected and additional sites will be determined in consultation with KDHE partners and agricultural producers in the basin. Soils within the study area are predominantly clay loam and silty clay loam. The soil at the selected site is Pawnee clay loam (4 to 8 percent slopes, eroded) and represents 42.7% of the study area basin (USDA‐NRCS, 2023a). Relative effects of soil health BMPs will be assessed by comparing measured weather data to trends for soil moisture, soil temperature, and evapotranspiration in soils with and without implementation of BMPs. These measurements will be available on the internet through the NWIS; https://waterdata.usgs.gov/nwis.
Stream Bacteria and Macroinvertebrates:
KDHE will sample for bacteria (E. coli) weekly to bi-weekly at the study site during the contact recreation season (April 1 – Oct 31) and will coordinate with USGS to collect bacteria during USGS water-quality sampling events. KDHE will perform macroinvertebrate bioassessment annually in the spring in collaboration with USGS to assess annual changes in macroinvertebrate tolerance scores develop based on nutrient pollution levels as described in Stone and others (2012) as well as metrics developed by the state of Kansas.
Land Use:
KDHE will also provide land use assessments and surveys of the study area over the course of the study to allow comparison of land-use changes with changes in stream water-quality. Understanding these processes will help characterize fertilizer application effects on stream ecosystem health and function over the period of study. From these data, a comprehensive analysis will be conducted by USGS to characterize water‐quality and sediment trends as they relate to soil health applications within the basin and the effects on soil moisture, soil temperature and evapotranspiration in soils with and without implementation of BMPs. This analysis will include historical comparisons where those data exist. Samples and data will be collected by USGS staff at each sampling site.
Products:
Continuous and discrete streamflow, water‐quality, sediment, meteorologic, soil moisture, and soil temperature data, USGS approved sediment and nutrient surrogate models, presentations, and outreach. Publication of a USGS Scientific Investigations Report and Fact Sheet using data collected through 2028 will be determined based on inspection of the data and in consultation with the KDHE.
Issues and Potential Limitations:
Best Management Practices are land management practices that improve terrestrial or water quality. Measuring potential effects of agricultural BMP on stream‐water quality presents several challenges and it can be difficult to correlate BMP implementation with changes in stream water‐quality (U.S. Environmental Protection Agency, 1997). Cooperative partners (landowners) will need to agree on roles and responsibilities to ensure effects of BMP implementation are quantifiable. Efforts to adopt BMPs by agricultural producers are based on landowner willingness to participate in programs that provide payment to implement one of a large selection of approved BMPs and are not implemented systematically. As such, this results in a diffuse spatial distribution of any single BMP type over a range of soil and land use types as well as BMP implementations that may be applied over varying periods of time. Programs that assist landowners with BMP implementation often do not disclose implementation locations as part of the landowner agreement. Nondisclosure may increase landowner participation, but limits focused investigation into BMP effectiveness on in‐stream water quality. For this study, KDHE will provide information regarding BMP implementation position on the landscape. Studies likely require a complete inventory of BMP implementation across an entire watershed or geographic area to document for evaluating nonpoint source control measures (U.S. Environmental Protection Agency, 1997).
Resultant nutrient load reductions from BMP implementation may be unobservable. For example, if 25 percent of a watershed’s land area has implemented one BMP designed to reduce nutrient loads to streams by 10%, the overall in‐stream change would be a decrease of 2.5% (assuming the BMP is fully effective and other land use practices in the watershed have remained constant).
Given that loads are calculated as streamflow multiplied by concentration to yield a mass per unit of time and that streamflow measurements typically are within 5 to 10 percent of actual streamflow, the 2.5% change may not be detectable in calculated annual loads because the change is less than the associated streamflow error.
Water‐quality improvements from BMP implementation may not be evident because of lag time (the time elapsed between the implementation and the detection of measurable improvement in water‐quality; Meals and others, 2010) and concomitant BMP efforts in the watershed. Hydrology, vegetation growth, transport rate and path, hydraulic residence time, pollutant sorption properties, and ecosystem linkages are important processes that influence lag time (Meals and others, 2010).
Continuous water‐quality probes exist for nitrate but not for dissolved phosphorus. Current technology for measuring continuous dissolved phosphorus make use of a “wet chemistry” field unit that pumps water from a stream or lake and processes the sample with consumable reagents to determine and record phosphorus concentrations at the desired interval. These units are labor intensive to operate and do not work in the highly turbid waters in Kansas streams. This study may provide an ideal opportunity to highlight the need for dissolved phosphorus probes nationally.
References:
Broussard, W., and Turner, R.E., 2009, A century of changing land‐use and water quality relationships in the continental U.S.: Frontiers in Ecology and Environment, v. 7, no. 6, p. 302–307.
Falcone, J.A., Murphy, J.C., and Sprague, L.A., 2019. Regional patterns of anthropogenic influences on streams and rivers in the conterminous United States, from the early 1970s to 2012: Journal of Land Use Science, v. 13, no. 6, p. 585–614, https://doi.org/10.1080/1747423X.2019.1590473.
Meals, D.W., Dressing, S.A., and Davenport, T.E., 2010, Lag time in water quality response to best management practices: a review: Journal of Environmental Quality, v. 31, no. 1, p. 85–96, https://pdfs.semanticscholar.org/aab9/6b90bc9d48349b8fb6ca0c4fbf4cc6458….
Rasmussen, P.P., Gray, J.R., Glysson, G.D., and Ziegler, A.C., 2009, Guidelines and procedures for computing timeseries suspended‐sediment concentrations and loads from in‐stream turbidity‐ sensor and streamflow data: U.S. Geological Survey Techniques and Methods, book 3, chap. C4, 52 p. https://pubs.usgs.gov/tm/tm3c4/pdf/TM3C4.pdf
Stone, M.L., Rasmussen, T.J., Bennett, T.J., Poulton, B.C., and Ziegler, A.C., 2012, Protocols for collection of streamflow, water‐quality, streambed‐sediment, periphyton, macroinvertebrate, fish, and habitat data to describe stream quality for the Hydrobiological Monitoring
Program, Equus Beds Aquifer Storage and Recovery Program, city of Wichita, Kansas: U.S. Geological Survey Open‐File Report 2012–1055, 55 p.
Turner, R.E., and Rabelais, N.N., 2004, Suspended sediment, C, N, P, and Si yields from the Mississippi River Basin: Hydrobiologia v. 511, p. 78–89.
USDA‐NRCS. 2023a. Web Soil Survey. USDA‐NRCS. https://websoilsurvey.nrcs.usda.gov/app/WebSoilSurvey.aspx (accessed 25 Apr. 2023).
USDA‐NRCS. 2023b. Soil health. USDA‐NRCS. https://www.nrcs.usda.gov/wps/portal/nrcs/main/soils/health/ (accessed 29 Mar.2023).
U.S. Environmental Protection Agency, 1996, Nonpoint source pollution: the Nation’s largest water quality problem: Washington D.C., U.S. Environmental Protection Agency, Office of Water, EPA 841‐F‐96‐004A, 2 p., https://nepis.epa.gov/Exe/ZyPDF.cgi/20004PZG.PDF?Dockey=20004PZG.PDF.
U.S. Environmental Protection Agency, 1997, Techniques for tracking, evaluating, and reporting the implementation of nonpoint source control measures I. Agriculture: Washington D.C., U.S. Environmental Protection Agency, Office of Water, EPA 841‐B‐97‐010, variously paged, https://www.epa.gov/sites/production/files/2015‐09/documents/2000_01_04_nps_agfinal‐ 2.pdf.
U.S. Environmental Protection Agency, 2017, National water quality inventory: report to Congress: Washington D.C., U.S. Environmental Protection Agency, Office of Water, EPA 841‐R‐16‐011, 21 p., https://www.epa.gov/sites/production/files/2017‐ 12/documents/305brtc_finalowow_08302017.pdf.
U.S. Geological Survey, 1999, The quality of our nation’s waters—Nutrients and pesticides: U.S. Geological Survey Circular 1225, 82 p., https://pubs.usgs.gov/circ/circ1225/pdf/front.pdf