
Winter 2026 Newsletter - In The Flow
In this Winter 2026 edition: 2025 By the Numbers • Ice Measurements • 6PPDQ Study • Water Data Transition • New Streamflow Charts • New Publications
2025 in the Rear-View Mirror
Sometimes you don’t truly realize how much you’ve accomplished in a year until you take a step back.
Here are the stats from calendar year 2025 that highlight our Center’s commitment to providing world class water science for the Maryland, Delaware, and Washington, D.C. region.
👉 Over 20 million data points collected
That’s more than a data point every two seconds, every day, for an entire year. And we make sure to review all that data for accuracy.
️➡️ 4000 field visits
Every one of our approximately 4000 field visits to a river, stream, groundwater well or other monitoring site ensures the reliability of our data. You might think that our sites can operate by themselves, but people are needed to sample, measure, verify, and repair any equipment malfunctions. Our dedicated hydrologic technicians keep our streamgages maintained and our data sound.
️👉 Around 1800 record approvals
To ensure accuracy, our experts review all provisional water data before marking it “approved” for the historical record.
➡️ 592 water-quality samples
Our water samples from rivers and streams provide a consistent record of our region’s water quality and are pivotal for studying changes and trends in the health of Chesapeake Bay and other watersheds.
👉️ 27 groundwater quality samples
We collected water samples at 27 groundwater wells, providing a snapshot of the region’s groundwater quality for the historical record.
➡️ 8 new monitoring sites
Every site we monitor has a purpose. We work with our partners to monitor rivers, streams, and other water-related sites to ensure they have the data they need.
👉 64 science products published
Our scientists published and contributed to science about the Chesapeake Bay, Potomac River, agricultural watersheds in Maryland, national hydrologic modelling and forecasting, and more!
➡️ 745 sites maintained
We have 186 real-time streamgages monitoring our streams and rivers, including 55 sites tracking continuous, real-time water-quality, 25 real-time sites tracking groundwater levels, and 450 non-real-time groundwater sites, among others.
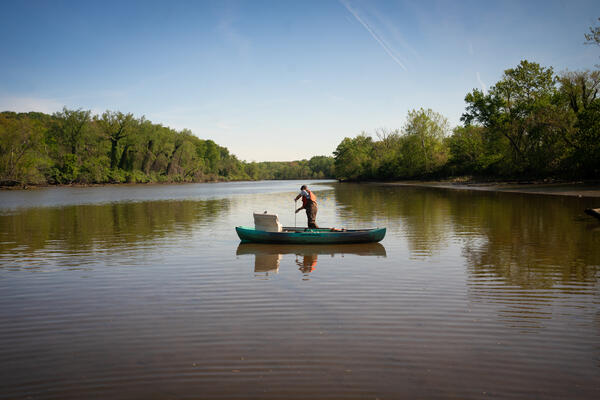
A Day’s Work Measuring an Icy River in One Frame
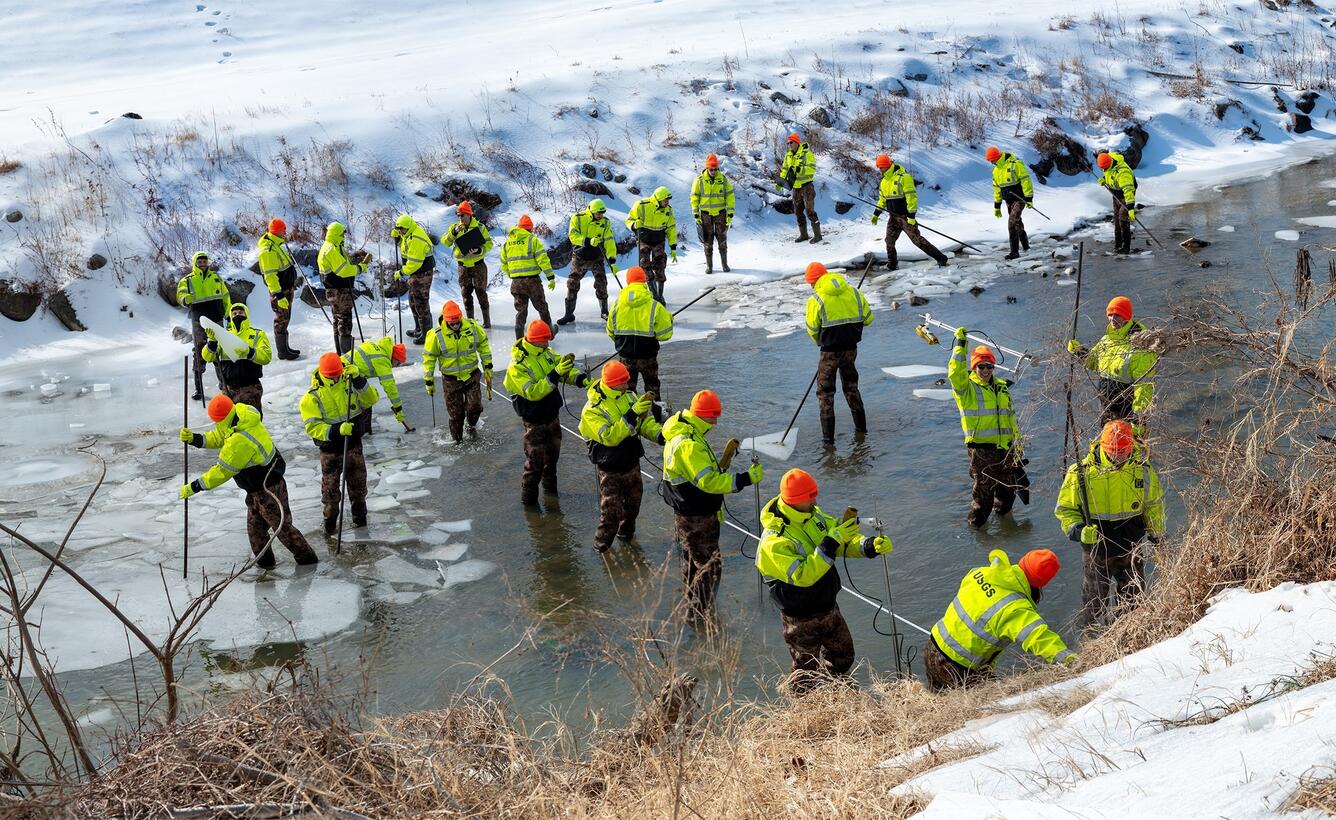
During the recent cold snap, our hydrologic technicians measured streamflow at over a dozen iced-over streams and rivers. We measure even in these frigid conditions to have a complete snapshot of streams and rivers in all conditions and times of year as part of our mission to provide high-quality data you can rely on.
This photo composite of 31 images over the course of several hours shows hydrologic technicians Nick Giro, Ashley Ryan, and Augustine Barquin breaking up an icy river and measuring streamflow in the Northwest Branch Anacostia River at Brentwood, MD (USGS-01651003).
Video Corner
🧊 Our Work Continues in the Winter
To ensure year-round record of our streams, we break the ice. Let’s not make things awkward. Bundle up for our latest video on how we measure rivers in frozen conditions.
USGS Studies 6PPDQ in Northwest Branch Anacostia River
When car tires degrade and leave behind small bits and pieces of rubber in the environment, a contaminant called 6PPDQ can get washed into streams where it is harmful to Coho Salmon and other salmonids, like brook trout which are native to Maryland.
Even brief exposure to this contaminant can affect the fish, but we’re not always there to detect it when it rains.
New technology has enabled scientists to collect samples remotely, giving them the edge in studying concentrations of this contaminant during and immediately after storms. Hydrologic technicians Tyler and Laura explain how automatic sampling helps them collect data even when not on scene.
Learn about the new water data features on Water Data for the Nation
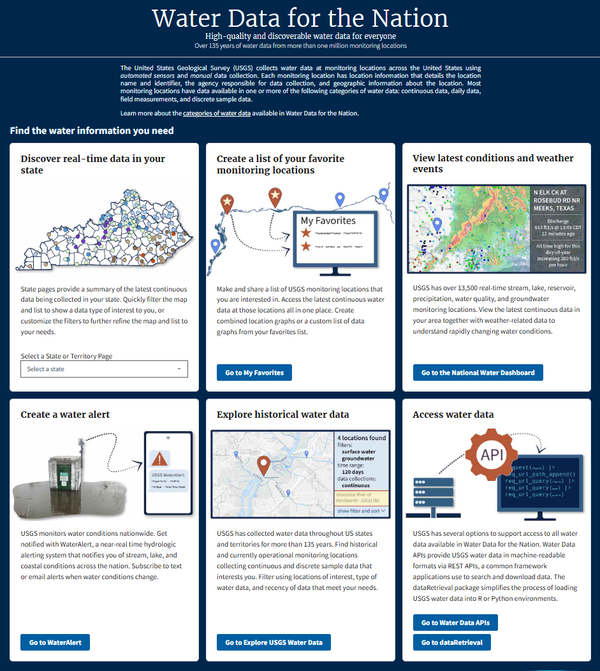
The USGS is changing how we report water data, transitioning from NWISweb to Water Data for the Nation (WDFN).
If you use the USGS to get your water data, you have probably already noticed this change. The WDFN team working on the updates recently held a webinar explaining what’s new and the next steps.
After decades of service, the legacy NWISWeb pages and related tools – including Water Services and WaterWatch – will be retired. Some groundwater features are already frozen, and access to most NWISWeb pages will end by March 2026.
What’s Changing
- The way you access USGS water data is changing, but the data itself will remain available.
- Legacy NWISWeb pages will begin redirecting to Water Data for the Nation (WDFN) tools and services. Most redirects will be complete by March 2026.
- APIs will remain available longer but are scheduled for decommissioning in early 2027. We encourage API users to begin transitioning now to avoid disruptions.
- New features include modern APIs, interactive maps, charts, and tables for exploring water data.
What You Need to Do
- If you rely on NWISWeb pages or Water Services for data access, start transitioning to WDFN tools and APIs now.
- Update any bookmarks or scripts that point to legacy URLs. Redirects will remain in place for about a year after March 2026, but old links will eventually stop working.
- To learn how to update common workflows, please see NWISweb Decommission Campaign 2 | Water Data For The Nation Blog
Learn More
- Watch our webinar to learn more about the plans for decommissioning NWISWeb.
- Visit: https://waterdata.usgs.gov for tutorials and resources.
- Subscribe to the WDFN Newsletter (subscribe for updates).
- Questions? Email: GS-W_Waterdata_Support@usgs.gov.
The WDFN team appreciates your partnership and are here to help make this transition smooth.
We now have colorful charts for daily average streamflow! 📊
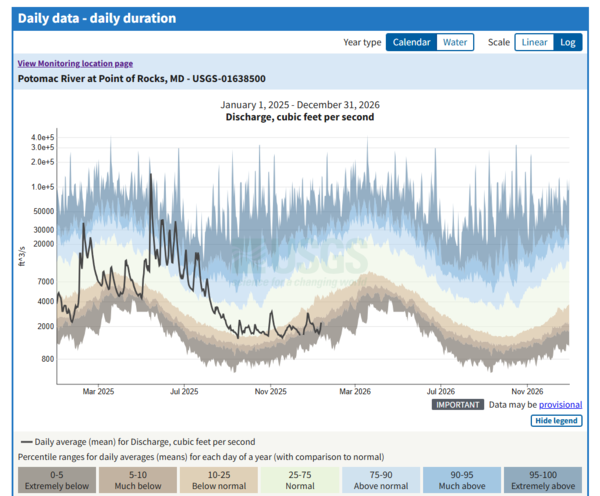
As part of the updated Water Data for the Nation (WDFN) website, the WDFN team has released daily average flow charts compare today’s flow to the daily historical average, allowing users to see at a glance whether recent flow has been higher or lower than normal.
And it’s not just for the MD-DE-DC region. This feature is available at many sites across the nation where there is enough data.
To access this chart, go to a monitoring site page:
1️⃣ Select “Show these data types” for Daily Data
2️⃣ Graph discharge
3️⃣ Underneath the chart, select “View related graphs”
4️⃣ Click “Statistical graphs for daily mean data”
🔗 This will bring you to a separate page with the chart.
🔖 You can bookmark that page for easy access.
Here’s an example page using our Potomac River at Point of Rocks site.
Publication Publicity
The lands and waters of the Chesapeake Bay watershed provide more than \$100 billion in economic benefits - an amount that is expected to increase by achieving the region’s clean-water goals. Achieving those goals requires accurate and timely information about the health of the watershed’s rivers and streams.
These are a selection of latest publications and data releases that our Center’s scientists contributed to: