
The Applied Hydrology Branch provides hydrologic data, research, and tools to water resource managers, stakeholders and policy makers that inform critical water management decisions throughout New England. This branch is divided into the Hydrology and Hydraulics Section, Water Quality Networks Section, Connecticut Water Quality Monitoring Section, and Massachusetts/Rhode Island Water Quality Monitoring Section.
Hydrology and Hydraulics Section
Section Chief: Pamela Lombard
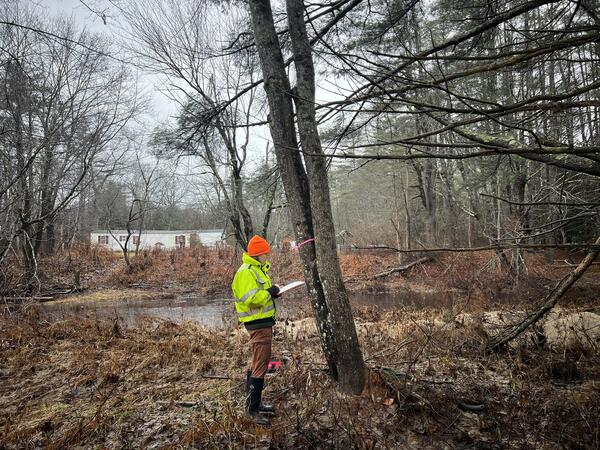
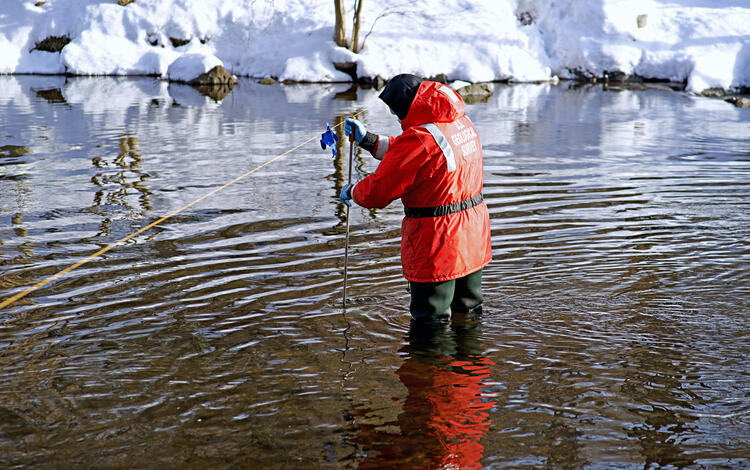
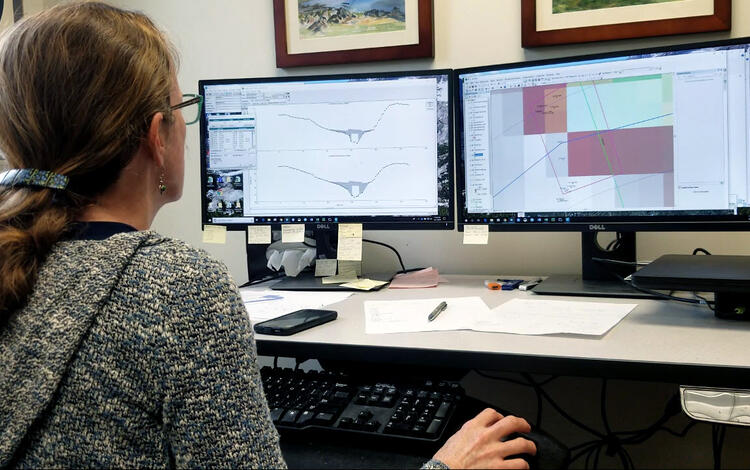
Staff in the Hydrology and Hydraulics Section investigate surface-water processes, develop models and tools to estimate water quantity in rivers and streams, and provide statistical and engineering analyses to New England policymakers, planners, and resource managers. This section develops quantitative surface water assessments, including the development of statistical streamflow equations, flood and drought documentation, and flood risk analyses.
The section has several large focus areas:
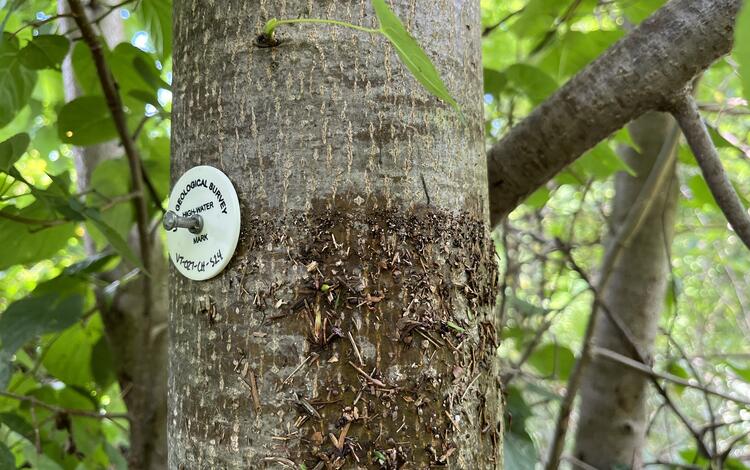
- Creating flood insurance rate maps (FIRMs) for communities in New England, which is done in cooperation with the Federal Emergency Management Agency (FEMA).
- Calculating future hydrology statistics for high flow conditions and throughout the full range of natural flows.
- Creating regression equations for streams that do not have streamgages that measure streamflow. The equations are historical, state based and cover a range from high flow, low flow, flow duration, time to peak, and climate trends.
Updated flood maps and regression equations allows citizens, communities, and decision maker to better understand risks and plan for future development. Public awareness prior to flooding occurring is critical for protection of life and property.
Water Quality Networks Section
Section Chief: Denise Argue
Staff in this section investigate surface-water quality processes, develops models and tools to estimate water quality in rivers, streams, and estuaries, and provides statistical analyses to New England policymakers, planners, and natural resource managers. Additionally, staff develop surface water quality assessments, including statistical models and load calculations.
The Water Quality Networks Section provides leadership and project management for many programs in Connecticut, Rhode Island, and Massachusetts. These data networks focus on short- and long-term physical-chemical monitoring. Scientists collect data from a variety of locations and watershed sizes throughout the networks. Data from the networks are used to estimate nutrient and other constituent loads and assess short- and long-term trends in water quality. The networks include discrete water quality sampling and continuous water quality monitoring.
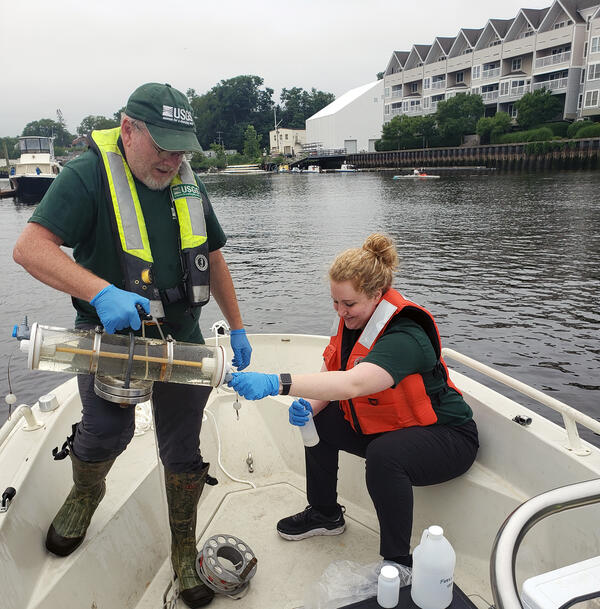
Discrete water-quality samples are collected on a routine schedule that can vary between quarterly to more than monthly but can also target specific environmental conditions, including storm sampling, baseflow conditions or tidal conditions. Discrete water quality samples are collected, processed, and then sent to the USGS National Water Quality Laboratory in Denver, Colorado, to test for a variety of analytes, such as major ions, nutrients, trace metals, bacteria, and chlorophyll a.
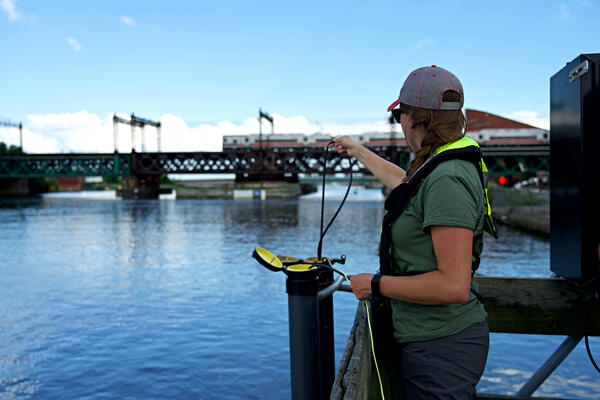
Continuous water-quality data are collected using multiparameter unattended monitors. These monitors measure water-quality conditions on site and can log data between 5- and 15-minute intervals. These data are often transmitted in near-real-time to the USGS National Water Information System (NWIS) database. Continuous water-quality monitors can measure water-quality parameters such as temperature, specific conductance, pH, dissolved oxygen, turbidity, chlorophyll a, UV-nitrate, and fluorescent dissolved organic matter (fDOM). These monitors are routinely serviced to ensure accurate readings. During the site visits, sensors are cleaned and calibrated to ensure the data collected are accurate. All the records are then stored, analyzed, and approved in the Aquarius data system and released to NWIS.
Water Quality Monitoring Section
Section Chief: Brittney Izbicki
Staff in this section conduct a number of data collection activities. Networks focus on short- and long-term physical-chemical monitoring. Scientists collect data from a variety of locations and watershed sizes throughout the networks. Data from the networks are used to estimate nutrient and other constituent loads and assess short- and long-term trends in water quality. The networks include discrete water quality sampling and continuous water quality monitoring.
Discrete water-quality samples are collected on a routine schedule that can vary between quarterly to more than monthly but can also target specific environmental conditions, including storm sampling, baseflow conditions or tidal conditions. Discrete water quality samples are collected, processed, and then sent to the USGS National Water Quality Laboratory in Denver, Colorado, to test for a variety of analytes, such as major ions, nutrients, trace metals, bacteria and chlorophyll a.
Continuous water-quality data are collected using multiparameter unattended monitors. These monitors measure water-quality conditions on site and can log data between 5- and 15-minute intervals. These data are often transmitted in near-real-time to the USGS National Water Information System (NWIS) database. Continuous water-quality monitors can measure water-quality parameters such as water temperature, specific conductance, pH, dissolved oxygen, turbidity, chlorophyll a, UV-nitrate, and fluorescent dissolved organic matter (fDOM). These monitors are routinely serviced to ensure accurate readings. During the site visits, sensors are cleaned and calibrated to ensure the data collected are accurate. All the records are then stored, analyzed and approved in the Aquarius data system and released to NWIS.
The Applied Hydrology Branch provides hydrologic data, research, and tools to water resource managers, stakeholders and policy makers that inform critical water management decisions throughout New England. This branch is divided into the Hydrology and Hydraulics Section, Water Quality Networks Section, Connecticut Water Quality Monitoring Section, and Massachusetts/Rhode Island Water Quality Monitoring Section.
Hydrology and Hydraulics Section
Section Chief: Pamela Lombard
Staff in the Hydrology and Hydraulics Section investigate surface-water processes, develop models and tools to estimate water quantity in rivers and streams, and provide statistical and engineering analyses to New England policymakers, planners, and resource managers. This section develops quantitative surface water assessments, including the development of statistical streamflow equations, flood and drought documentation, and flood risk analyses.
The section has several large focus areas:
- Creating flood insurance rate maps (FIRMs) for communities in New England, which is done in cooperation with the Federal Emergency Management Agency (FEMA).
- Calculating future hydrology statistics for high flow conditions and throughout the full range of natural flows.
- Creating regression equations for streams that do not have streamgages that measure streamflow. The equations are historical, state based and cover a range from high flow, low flow, flow duration, time to peak, and climate trends.
Updated flood maps and regression equations allows citizens, communities, and decision maker to better understand risks and plan for future development. Public awareness prior to flooding occurring is critical for protection of life and property.
Water Quality Networks Section
Section Chief: Denise Argue
Staff in this section investigate surface-water quality processes, develops models and tools to estimate water quality in rivers, streams, and estuaries, and provides statistical analyses to New England policymakers, planners, and natural resource managers. Additionally, staff develop surface water quality assessments, including statistical models and load calculations.
The Water Quality Networks Section provides leadership and project management for many programs in Connecticut, Rhode Island, and Massachusetts. These data networks focus on short- and long-term physical-chemical monitoring. Scientists collect data from a variety of locations and watershed sizes throughout the networks. Data from the networks are used to estimate nutrient and other constituent loads and assess short- and long-term trends in water quality. The networks include discrete water quality sampling and continuous water quality monitoring.
Discrete water-quality samples are collected on a routine schedule that can vary between quarterly to more than monthly but can also target specific environmental conditions, including storm sampling, baseflow conditions or tidal conditions. Discrete water quality samples are collected, processed, and then sent to the USGS National Water Quality Laboratory in Denver, Colorado, to test for a variety of analytes, such as major ions, nutrients, trace metals, bacteria, and chlorophyll a.
Continuous water-quality data are collected using multiparameter unattended monitors. These monitors measure water-quality conditions on site and can log data between 5- and 15-minute intervals. These data are often transmitted in near-real-time to the USGS National Water Information System (NWIS) database. Continuous water-quality monitors can measure water-quality parameters such as temperature, specific conductance, pH, dissolved oxygen, turbidity, chlorophyll a, UV-nitrate, and fluorescent dissolved organic matter (fDOM). These monitors are routinely serviced to ensure accurate readings. During the site visits, sensors are cleaned and calibrated to ensure the data collected are accurate. All the records are then stored, analyzed, and approved in the Aquarius data system and released to NWIS.
Water Quality Monitoring Section
Section Chief: Brittney Izbicki
Staff in this section conduct a number of data collection activities. Networks focus on short- and long-term physical-chemical monitoring. Scientists collect data from a variety of locations and watershed sizes throughout the networks. Data from the networks are used to estimate nutrient and other constituent loads and assess short- and long-term trends in water quality. The networks include discrete water quality sampling and continuous water quality monitoring.
Discrete water-quality samples are collected on a routine schedule that can vary between quarterly to more than monthly but can also target specific environmental conditions, including storm sampling, baseflow conditions or tidal conditions. Discrete water quality samples are collected, processed, and then sent to the USGS National Water Quality Laboratory in Denver, Colorado, to test for a variety of analytes, such as major ions, nutrients, trace metals, bacteria and chlorophyll a.
Continuous water-quality data are collected using multiparameter unattended monitors. These monitors measure water-quality conditions on site and can log data between 5- and 15-minute intervals. These data are often transmitted in near-real-time to the USGS National Water Information System (NWIS) database. Continuous water-quality monitors can measure water-quality parameters such as water temperature, specific conductance, pH, dissolved oxygen, turbidity, chlorophyll a, UV-nitrate, and fluorescent dissolved organic matter (fDOM). These monitors are routinely serviced to ensure accurate readings. During the site visits, sensors are cleaned and calibrated to ensure the data collected are accurate. All the records are then stored, analyzed and approved in the Aquarius data system and released to NWIS.