
A floating water-quality station that can only be accessed by boat! Sensors hang in the water below the platform. The data is collected and transmits via satellite to the internet.
Water-quality monitoring during reservoir drawdowns
Active
By Oregon Water Science Center
February 26, 2026
The USGS is monitoring water-quality above, within, and below Middle Fork Willamette and the South Santiam River dams using field-based and remote-sensing approaches to understand how reservoir drawdowns influence downstream water-quality conditions.
Background:
The U.S. Army Corps of Engineers (USACE) conducts reservoir drawdowns to help migrating juvenile spring Chinook (Oncorhynchus tshawytscha) and steelhead (Oncorhynchus mykiss) make it downstream past dams and increase their survival rates. Reservoirs are drawn down gradually until they are near the level of the dam’s regulating outlet. The drawdowns can carry accumulated sediments and organic matter downstream affecting water clarity and possibly impacting dissolved oxygen (DO) levels. Transport and deposition of large amounts of sediment to downstream river reaches may have adverse effects on water-quality, aquatic life, and recreational use. Previous drawdowns at Fall Creek Dam resulted in temporarily high turbidity and suspended sediment concentrations and low DO levels. Water temperature is also influenced by dam operations. Thermal stratification occurs within reservoirs, where cold dense water sinks to the bottom with warmer, less dense water on top. This effectively alters river water temperatures. Due to multiple possible impacts of reservoir drawdowns, monitoring sediment and water-quality responses is necessary for reservoir managers. USACE is interested in understanding how the release of sediment influences turbidity, water temperature and DO in rivers downstream of the dams, where drawdowns have been mandated.
To help with this effort, USGS is conducting field-based turbidity, water temperature and DO monitoring in the South Santiam and Middle Willamette Rivers below Fall Creek, Lookout Point and Green Peter reservoirs. Additionally, a suite of high-resolution satellite imagery is being compiled to document turbidity patterns both within and downstream of the reservoirs. These data benefit USACE, environmental researchers and the public in understanding downstream temperature, turbidity and DO responses to drawdowns. In the long term, USGS monitoring can also provide important information in efforts to understand the amount of time needed for water quality conditions to reach background levels expected in these waterways and defined by previous studies.
In addition to water-quality monitoring, USGS measures reservoir lake levels, total dissolved gas, dam tailwater levels, and streamflow above and below USACE reservoirs. These USGS water‑quantity data support safety and flood‑risk management.
Water-quality monitoring objectives:
- Collect turbidity, temperature and DO time-series data every 15-minutes at the sites listed below, on an ongoing or annual basis.
- Display and make provisional data available to the USACE and the public in real-time and provide approved data records every 150-days in the USGS National Water Information System Time Series (NWIS-TS) website USGS Water Data for the Nation.
- Provide USACE and the public satellite-based maps of turbidity conditions across and downstream of the reservoirs through the USGS data repository, ScienceBase.
Monitoring Locations:
Middle Fork Willamette below Lookout Point Reservoir, Oregon (14149011)
Middle Fork Willamette below Lookout Point Reservoir, Oregon (14149011)
Fall Creek below Winberry Creek, Near Fall Creek, Oregon (14151000)
Fall Creek below Winberry Creek, Near Fall Creek, Oregon (14151000)
Middle Fork Willamette River at Jasper, Oregon (14152000)
Middle Fork Willamette River at Jasper, Oregon (14152000)
Middle Santiam River below Green Peter Dam near Foster, Oregon (14186200)
Middle Santiam River below Green Peter Dam near Foster, Oregon (14186200)
South Santiam River near Foster, Oregon (14187200)
South Santiam River near Foster, Oregon (14187200)
South Santiam River at Waterloo, Oregon (14187500)
South Santiam River at Waterloo, Oregon (14187500)
Foster Lake below Gedney Creek, Oregon (442453122394900)
Foster Lake below Gedney Creek, Oregon (442453122394900)
Quartzville Creek Near Cascadia, Oregon (14185900)
Quartzville Creek Near Cascadia, Oregon (14185900)
Middle Fork Willamette River Near Dexter, Oregon (14150000)
Middle Fork Willamette River Near Dexter, Oregon (14150000)
South Santiam River Below Cascadia, Oregon (14185000)
South Santiam River Below Cascadia, Oregon (14185000)
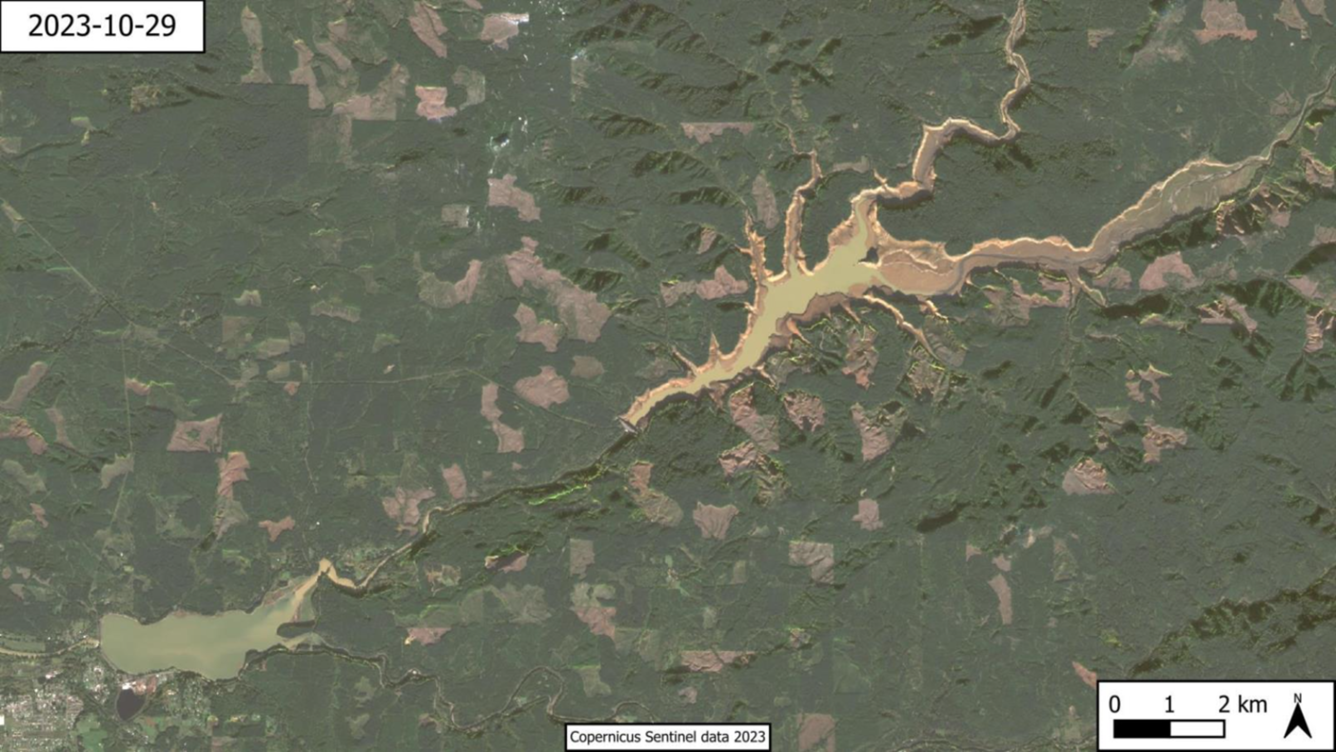
Satellite image of Foster and Green Peter Lakes showing turbidity conditions during the 2023 drawdown:
Media
Sources/Usage: Public Domain. View Media Details

Water-quality pontoon on Foster Lake, Oregon
A floating water-quality station that can only be accessed by boat! Sensors hang in the water below the platform. The data is collected and transmits via satellite to the internet.

Water-quality pipe at the South Santiam River in Waterloo, Oregon
Water-quality pipe at the South Santiam River in Waterloo, OregonA tree mounted white PVC pipe houses water-quality sensors along the South Santiam River.
Water-quality pipe at the South Santiam River in Waterloo, Oregon
Water-quality pipe at the South Santiam River in Waterloo, OregonA tree mounted white PVC pipe houses water-quality sensors along the South Santiam River.

Water-quality pipe below Lookout Point Dam
Grey and black PVC piping housing the water-quality sensors for this stream gage.
Grey and black PVC piping housing the water-quality sensors for this stream gage.

Water-quality sensors on the Willamette River, Jasper Oregon
Water-quality sensors on the Willamette River, Jasper OregonThe grey PVC pipe is securely mounted on the river bank to house water-quality instruments.
Water-quality sensors on the Willamette River, Jasper Oregon
Water-quality sensors on the Willamette River, Jasper OregonThe grey PVC pipe is securely mounted on the river bank to house water-quality instruments.

South Santiam River near Foster, Oregon
Photo taken during the Green Peter Reservoir drawdown The water is brown due to suspended sediment loads.
Photo taken during the Green Peter Reservoir drawdown The water is brown due to suspended sediment loads.

Fall Creek meets the Middle Willamette River flows
Fall Creek meets the Middle Willamette River flowsA striking contrast between the clear water in the Middle Fork Willamette River and brown water in Fall Creek. The flows from Fall Creek dam during this time had heavy loads of suspended sediment from the reservoir drawdown.


View from the cableway at Fall Creek, OR
Photo taken by Lisa Hoaks while she measured the streamflow of Fall Creek from the cableway. Looking downstream towards Unity Covered Bridge.
Photo taken by Lisa Hoaks while she measured the streamflow of Fall Creek from the cableway. Looking downstream towards Unity Covered Bridge.

Green Peter Dam
Water rushing down the spillway at Green Peter Dam to join the Middle Santiam River. PC: Heather Bragg, 2022.
Water rushing down the spillway at Green Peter Dam to join the Middle Santiam River. PC: Heather Bragg, 2022.

Instrument pipes at 14186200 below Green Peter Dam
Instrument pipes at 14186200 below Green Peter DamPVC pipes housing total dissolved gas sensor cables at the Santiam River below Green Peter Dam. PC: Heather Bragg, 2022.
Instrument pipes at 14186200 below Green Peter Dam
Instrument pipes at 14186200 below Green Peter DamPVC pipes housing total dissolved gas sensor cables at the Santiam River below Green Peter Dam. PC: Heather Bragg, 2022.

Water-quality pipes below Fall Creek Dam, Oregon
Two black stacked PVC pipes along Fall Creek house water-quality sensors. The bottom pipe has the sensors deployed at the site and the top is used to deploy reference sensors during site calibration and cleaning visits.
Two black stacked PVC pipes along Fall Creek house water-quality sensors. The bottom pipe has the sensors deployed at the site and the top is used to deploy reference sensors during site calibration and cleaning visits.

South Santiam River near Foster, Oregon
The gage house is sitting on a circular metal base also known as a stilling well. Stilling wells fill with calm water that is equal to the height of the river that is read by sensors inside. This technique has been in use for decades to collect water level data.
The gage house is sitting on a circular metal base also known as a stilling well. Stilling wells fill with calm water that is equal to the height of the river that is read by sensors inside. This technique has been in use for decades to collect water level data.
The USGS is monitoring water-quality above, within, and below Middle Fork Willamette and the South Santiam River dams using field-based and remote-sensing approaches to understand how reservoir drawdowns influence downstream water-quality conditions.
Background:
The U.S. Army Corps of Engineers (USACE) conducts reservoir drawdowns to help migrating juvenile spring Chinook (Oncorhynchus tshawytscha) and steelhead (Oncorhynchus mykiss) make it downstream past dams and increase their survival rates. Reservoirs are drawn down gradually until they are near the level of the dam’s regulating outlet. The drawdowns can carry accumulated sediments and organic matter downstream affecting water clarity and possibly impacting dissolved oxygen (DO) levels. Transport and deposition of large amounts of sediment to downstream river reaches may have adverse effects on water-quality, aquatic life, and recreational use. Previous drawdowns at Fall Creek Dam resulted in temporarily high turbidity and suspended sediment concentrations and low DO levels. Water temperature is also influenced by dam operations. Thermal stratification occurs within reservoirs, where cold dense water sinks to the bottom with warmer, less dense water on top. This effectively alters river water temperatures. Due to multiple possible impacts of reservoir drawdowns, monitoring sediment and water-quality responses is necessary for reservoir managers. USACE is interested in understanding how the release of sediment influences turbidity, water temperature and DO in rivers downstream of the dams, where drawdowns have been mandated.
To help with this effort, USGS is conducting field-based turbidity, water temperature and DO monitoring in the South Santiam and Middle Willamette Rivers below Fall Creek, Lookout Point and Green Peter reservoirs. Additionally, a suite of high-resolution satellite imagery is being compiled to document turbidity patterns both within and downstream of the reservoirs. These data benefit USACE, environmental researchers and the public in understanding downstream temperature, turbidity and DO responses to drawdowns. In the long term, USGS monitoring can also provide important information in efforts to understand the amount of time needed for water quality conditions to reach background levels expected in these waterways and defined by previous studies.
In addition to water-quality monitoring, USGS measures reservoir lake levels, total dissolved gas, dam tailwater levels, and streamflow above and below USACE reservoirs. These USGS water‑quantity data support safety and flood‑risk management.
Water-quality monitoring objectives:
- Collect turbidity, temperature and DO time-series data every 15-minutes at the sites listed below, on an ongoing or annual basis.
- Display and make provisional data available to the USACE and the public in real-time and provide approved data records every 150-days in the USGS National Water Information System Time Series (NWIS-TS) website USGS Water Data for the Nation.
- Provide USACE and the public satellite-based maps of turbidity conditions across and downstream of the reservoirs through the USGS data repository, ScienceBase.
Monitoring Locations:
Middle Fork Willamette below Lookout Point Reservoir, Oregon (14149011)
Middle Fork Willamette below Lookout Point Reservoir, Oregon (14149011)
Fall Creek below Winberry Creek, Near Fall Creek, Oregon (14151000)
Fall Creek below Winberry Creek, Near Fall Creek, Oregon (14151000)
Middle Fork Willamette River at Jasper, Oregon (14152000)
Middle Fork Willamette River at Jasper, Oregon (14152000)
Middle Santiam River below Green Peter Dam near Foster, Oregon (14186200)
Middle Santiam River below Green Peter Dam near Foster, Oregon (14186200)
South Santiam River near Foster, Oregon (14187200)
South Santiam River near Foster, Oregon (14187200)
South Santiam River at Waterloo, Oregon (14187500)
South Santiam River at Waterloo, Oregon (14187500)
Foster Lake below Gedney Creek, Oregon (442453122394900)
Foster Lake below Gedney Creek, Oregon (442453122394900)
Quartzville Creek Near Cascadia, Oregon (14185900)
Quartzville Creek Near Cascadia, Oregon (14185900)
Middle Fork Willamette River Near Dexter, Oregon (14150000)
Middle Fork Willamette River Near Dexter, Oregon (14150000)
South Santiam River Below Cascadia, Oregon (14185000)
South Santiam River Below Cascadia, Oregon (14185000)
Satellite image of Foster and Green Peter Lakes showing turbidity conditions during the 2023 drawdown:
Media
Sources/Usage: Public Domain. View Media Details
Water-quality pontoon on Foster Lake, Oregon
A floating water-quality station that can only be accessed by boat! Sensors hang in the water below the platform. The data is collected and transmits via satellite to the internet.
A floating water-quality station that can only be accessed by boat! Sensors hang in the water below the platform. The data is collected and transmits via satellite to the internet.
Water-quality pipe at the South Santiam River in Waterloo, Oregon
Water-quality pipe at the South Santiam River in Waterloo, OregonA tree mounted white PVC pipe houses water-quality sensors along the South Santiam River.
Water-quality pipe at the South Santiam River in Waterloo, Oregon
Water-quality pipe at the South Santiam River in Waterloo, OregonA tree mounted white PVC pipe houses water-quality sensors along the South Santiam River.
Water-quality pipe below Lookout Point Dam
Grey and black PVC piping housing the water-quality sensors for this stream gage.
Grey and black PVC piping housing the water-quality sensors for this stream gage.
Water-quality sensors on the Willamette River, Jasper Oregon
Water-quality sensors on the Willamette River, Jasper OregonThe grey PVC pipe is securely mounted on the river bank to house water-quality instruments.
Water-quality sensors on the Willamette River, Jasper Oregon
Water-quality sensors on the Willamette River, Jasper OregonThe grey PVC pipe is securely mounted on the river bank to house water-quality instruments.
South Santiam River near Foster, Oregon
Photo taken during the Green Peter Reservoir drawdown The water is brown due to suspended sediment loads.
Photo taken during the Green Peter Reservoir drawdown The water is brown due to suspended sediment loads.
Fall Creek meets the Middle Willamette River flows
Fall Creek meets the Middle Willamette River flowsA striking contrast between the clear water in the Middle Fork Willamette River and brown water in Fall Creek. The flows from Fall Creek dam during this time had heavy loads of suspended sediment from the reservoir drawdown.
View from the cableway at Fall Creek, OR
Photo taken by Lisa Hoaks while she measured the streamflow of Fall Creek from the cableway. Looking downstream towards Unity Covered Bridge.
Photo taken by Lisa Hoaks while she measured the streamflow of Fall Creek from the cableway. Looking downstream towards Unity Covered Bridge.
Green Peter Dam
Water rushing down the spillway at Green Peter Dam to join the Middle Santiam River. PC: Heather Bragg, 2022.
Water rushing down the spillway at Green Peter Dam to join the Middle Santiam River. PC: Heather Bragg, 2022.
Instrument pipes at 14186200 below Green Peter Dam
Instrument pipes at 14186200 below Green Peter DamPVC pipes housing total dissolved gas sensor cables at the Santiam River below Green Peter Dam. PC: Heather Bragg, 2022.
Instrument pipes at 14186200 below Green Peter Dam
Instrument pipes at 14186200 below Green Peter DamPVC pipes housing total dissolved gas sensor cables at the Santiam River below Green Peter Dam. PC: Heather Bragg, 2022.
Water-quality pipes below Fall Creek Dam, Oregon
Two black stacked PVC pipes along Fall Creek house water-quality sensors. The bottom pipe has the sensors deployed at the site and the top is used to deploy reference sensors during site calibration and cleaning visits.
Two black stacked PVC pipes along Fall Creek house water-quality sensors. The bottom pipe has the sensors deployed at the site and the top is used to deploy reference sensors during site calibration and cleaning visits.
South Santiam River near Foster, Oregon
The gage house is sitting on a circular metal base also known as a stilling well. Stilling wells fill with calm water that is equal to the height of the river that is read by sensors inside. This technique has been in use for decades to collect water level data.
The gage house is sitting on a circular metal base also known as a stilling well. Stilling wells fill with calm water that is equal to the height of the river that is read by sensors inside. This technique has been in use for decades to collect water level data.