



Green Peter Reservoir drawn down to a free-flowing stream channel winding through muddy sediment.
Water temperature modeling in the Willamette Valley
Active
By Oregon Water Science Center
October 2, 2026
The U.S. Geological Survey (USGS) monitors, studies, and models water temperature to better understand how dam releases affect stream temperature and flow.
Background:
For over 20 years the USGS has worked with the U.S. Army Corps of Engineers (USACE) and other partners to monitor and model water temperature, streamflow, and other water-quality variables in reservoirs downstream of dams in the Willamette Basin. These efforts support management decisions in the Willamette Valley where dams are congressionally authorized for flood-risk management, water quality, navigation, hydropower, irrigation, municipal and industrial water supply, recreation, and fish and wildlife purposes.
In the Willamette River Basin, cold-water adapted species including winter-run steelhead (Oncorhynchus mykiss), spring-run Chinook Salmon (O. tshawytscha), and resident bull trout (Salvelinus confluentus) are listed as threatened under the U.S. Endangered Species Act. Stream temperature is a critical factor in the survival, growth, and migration timing of spring Chinook salmon and winter steelhead; both species have narrow thermal tolerances, and prolonged exposure to warm water can delay migration, increase metabolic stress, and elevate susceptibility to disease (NOAA Fisheries, 2024; White and others, 2022).
River temperatures are influenced by reservoir operations at the 13 USACE dams in the Willamette River Basin. These reservoirs thermally stratify in summer, and releases from different dam outlet structures with differing elevations and withdrawal zones can release water that is either colder or warmer than natural conditions, shifting downstream temperature patterns. As water moves downstream, temperatures continue to adjust through interactions with the environment. These thermal and hydrologic changes are well documented across the basin and can differ by season, year, and dam.
To inform water management operations and planning in the Willamette River Basin, USGS and USACE use the CE-QUAL-W2 model. The model can be adapted to specific dam operations, reservoir characteristics, and environmental conditions. Over the years the USGS has updated, calibrated, and applied versions of the model to several Willamette Valley reservoirs and below-dam river corridors to simulate temperature responses to various operational scenarios.
The USGS’s technical expertise in modeling complex operational scenarios and implementing model improvements as needed has helped inform overall dam operations and planning.
Current modeling projects
Detroit Lake temperature and outflow analysis under modified dam operations
Detroit Dam on the North Santiam River is one of the tallest dams in the USACE Willamette Valley project, standing 463 feet tall. The dam helps to manage flood risks, generates power, provides recreational access, and influences instream flows and water quality.
In 2021, an early drawdown to enable the use of the lowest dam outlet was meant to release cooler water during salmon spawning. However, the releases were among the warmest on record for mid-October because warm surface waters in the lake had been drawn down to the level of the outlets, limiting access to cold water near the bottom. The USGS is evaluating this event and other modeling scenarios for Detroit Dam.
Objectives:
- Understand why 2021 releases were warm despite early drawdown.
- Use modeling to explore how outlet use, lake level, and weather affect temperature outcomes.
- Identify optimal dam operations to support cold-water fish habitat.
- Extend modeling to other Willamette Valley Project dams such as Green Peter, Cougar, Lookout Point.
- Develop tools to help managers predict release temperatures in real time.
Media
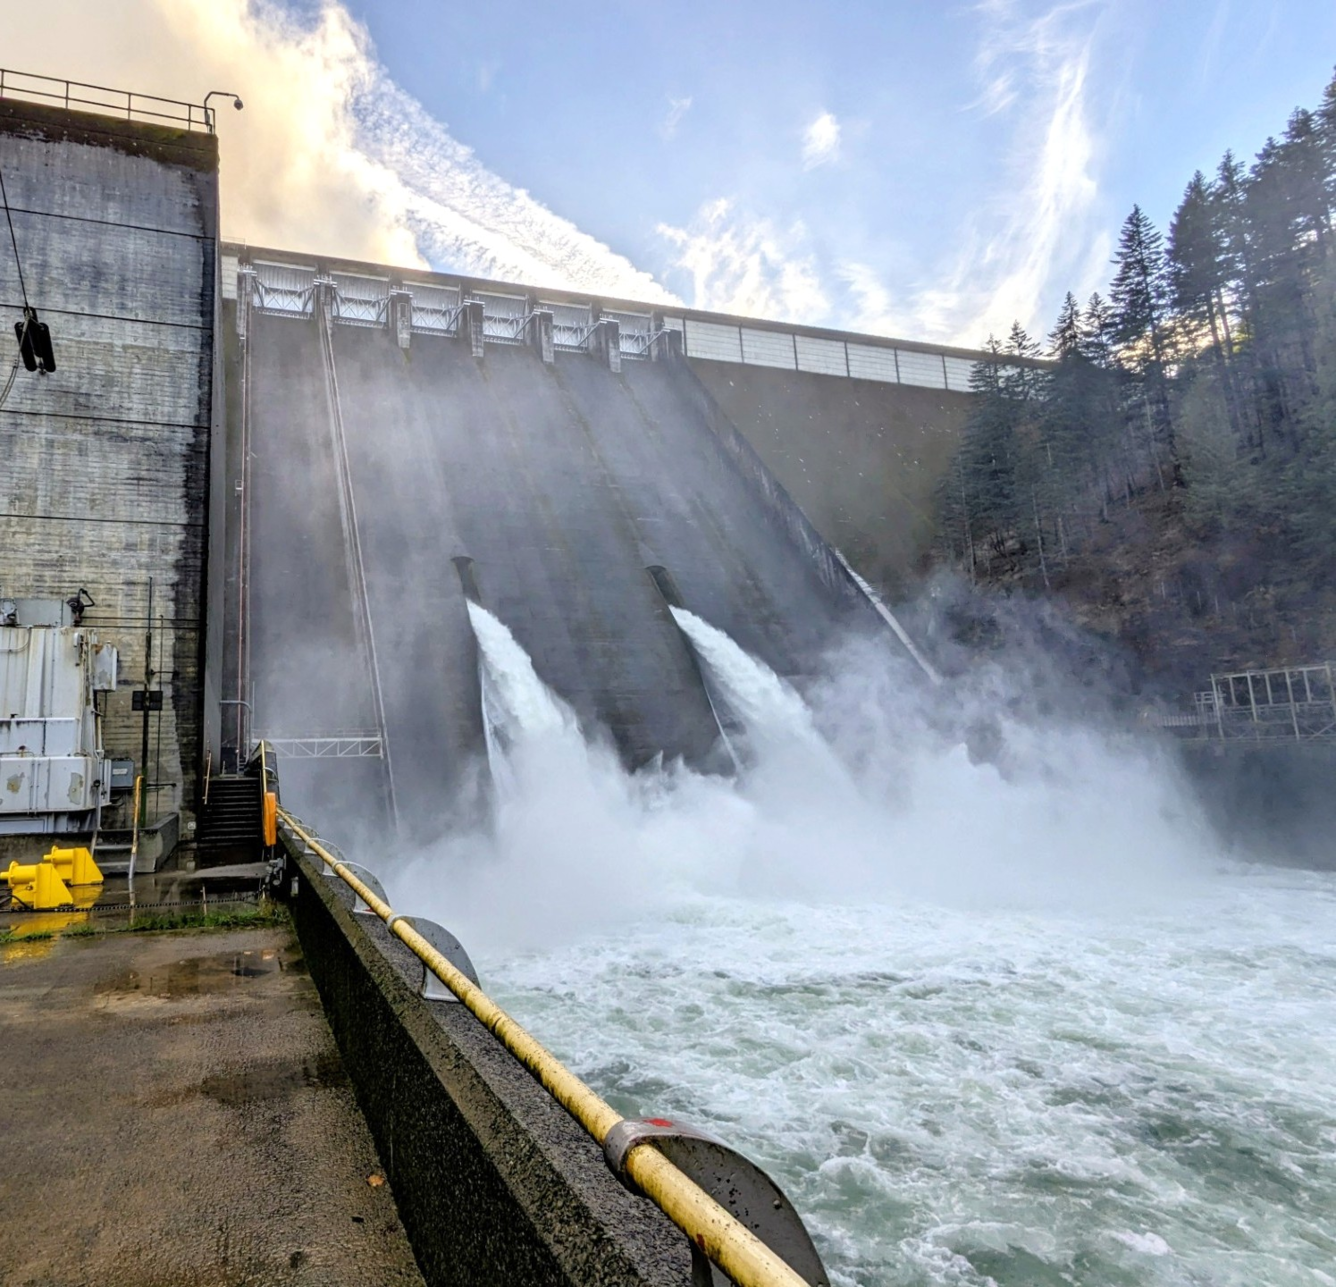
Sources/Usage: Public Domain. View Media Details
Willamette Reservoir Mixed Outflow Temperature Estimator (ReMOTE)
ReMOTE is an Excel-based application developed to estimate vertical withdrawal zones and overall mixed-release water temperatures. It uses measured temperature profiles, water surface elevation, hypothetical release rates, and dam outlet characteristics. The formula is based on selective withdrawal methods from the CE-QUAL-W2 model. The application is meant to evaluate and guide water management decisions and provide insights on water temperature immediately downstream of Willamette Valley Project dams. Like all models, the application is subject to uncertainties in the data and inherent assumptions of the algorithms used and does not provide exact predictions.
Drawdown scenarios for Green Peter and Foster Dams
Green Peter and Foster Dams in the South Santiam River basin operate in tandem to regulate flows for flood-risk management and to generate hydropower. Both reservoirs provide recreation access and habitat. In 2023, Green Peter Lake underwent a deep drawdown to support downstream fish passage for juvenile salmon.
The USGS updated the temperature model for Green Peter and Foster Lakes to reflect 2023 conditions, including the deep drawdown in Green Peter Lake.
Objectives:
- Update model inputs to reflect current conditions.
- Updated weather and river data sources.
- Light penetration in the water was adjusted to reflect increased turbidity during the drawdown.
- Dam outlet settings were modified to better simulate how water was released.
- Precipitation and river inflow estimates were updated using new data sources.
- Model how the timing of drawdowns might affect water temperatures in the reservoirs and downstream in three scenarios:
- Base – Drawdown reaches target lake elevation by November 15.
- Dec01 – Drawdown starts later but reaches target by December 1.
- Dec15 – Drawdown starts even later, reaching target by December 15.
Model outcomes are tools to support planning and decision making, not exact predictions.
Media

Sources/Usage: Public Domain. View Media Details
Project pages related to water temperature modeling in the Willamette Valley

Water-quality monitoring during reservoir drawdowns
The USGS is monitoring water-quality above, within, and below Middle Fork Willamette and the South Santiam River dams using field-based and remote-sensing approaches to understand how reservoir drawdowns influence downstream water-quality conditions.
Photos taken at Willamette Valley Dams during field work
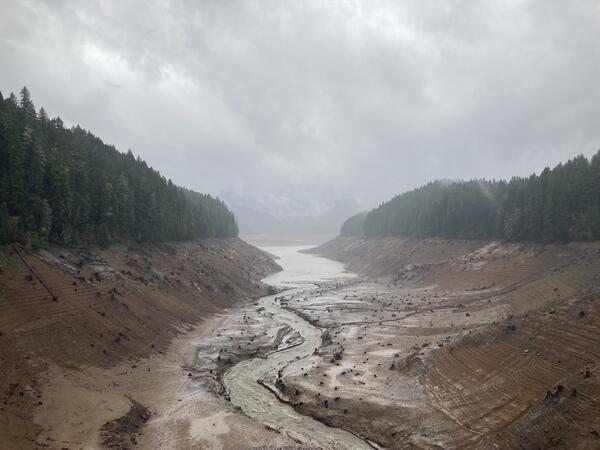
Green Peter Reservoir drawdown 2025
Green Peter Reservoir drawn down to a free-flowing stream channel winding through muddy sediment.
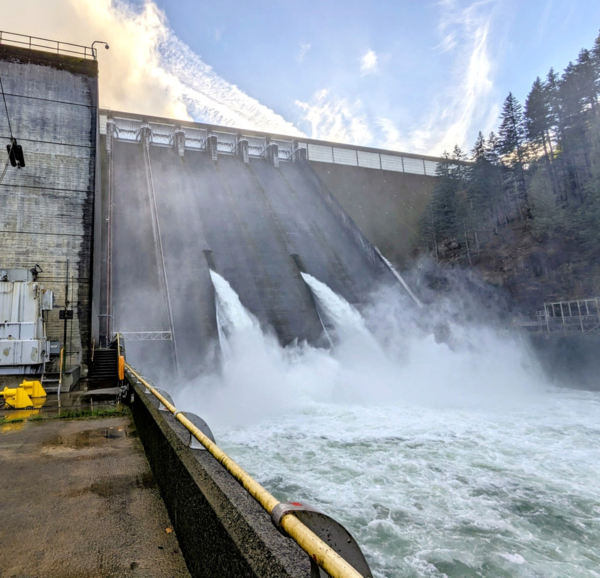
Detroit Dam spillway
Reservoir water gushes out of Detroit Dam outlets located midway up the spillway.
Reservoir water gushes out of Detroit Dam outlets located midway up the spillway.


Green Peter Dam
Water rushing down the top spillway at Green Peter Dam to join the Middle Santiam River.
Water rushing down the top spillway at Green Peter Dam to join the Middle Santiam River.
The U.S. Geological Survey (USGS) monitors, studies, and models water temperature to better understand how dam releases affect stream temperature and flow.
Background:
For over 20 years the USGS has worked with the U.S. Army Corps of Engineers (USACE) and other partners to monitor and model water temperature, streamflow, and other water-quality variables in reservoirs downstream of dams in the Willamette Basin. These efforts support management decisions in the Willamette Valley where dams are congressionally authorized for flood-risk management, water quality, navigation, hydropower, irrigation, municipal and industrial water supply, recreation, and fish and wildlife purposes.
In the Willamette River Basin, cold-water adapted species including winter-run steelhead (Oncorhynchus mykiss), spring-run Chinook Salmon (O. tshawytscha), and resident bull trout (Salvelinus confluentus) are listed as threatened under the U.S. Endangered Species Act. Stream temperature is a critical factor in the survival, growth, and migration timing of spring Chinook salmon and winter steelhead; both species have narrow thermal tolerances, and prolonged exposure to warm water can delay migration, increase metabolic stress, and elevate susceptibility to disease (NOAA Fisheries, 2024; White and others, 2022).
River temperatures are influenced by reservoir operations at the 13 USACE dams in the Willamette River Basin. These reservoirs thermally stratify in summer, and releases from different dam outlet structures with differing elevations and withdrawal zones can release water that is either colder or warmer than natural conditions, shifting downstream temperature patterns. As water moves downstream, temperatures continue to adjust through interactions with the environment. These thermal and hydrologic changes are well documented across the basin and can differ by season, year, and dam.
To inform water management operations and planning in the Willamette River Basin, USGS and USACE use the CE-QUAL-W2 model. The model can be adapted to specific dam operations, reservoir characteristics, and environmental conditions. Over the years the USGS has updated, calibrated, and applied versions of the model to several Willamette Valley reservoirs and below-dam river corridors to simulate temperature responses to various operational scenarios.
The USGS’s technical expertise in modeling complex operational scenarios and implementing model improvements as needed has helped inform overall dam operations and planning.
Current modeling projects
Detroit Lake temperature and outflow analysis under modified dam operations
Detroit Dam on the North Santiam River is one of the tallest dams in the USACE Willamette Valley project, standing 463 feet tall. The dam helps to manage flood risks, generates power, provides recreational access, and influences instream flows and water quality.
In 2021, an early drawdown to enable the use of the lowest dam outlet was meant to release cooler water during salmon spawning. However, the releases were among the warmest on record for mid-October because warm surface waters in the lake had been drawn down to the level of the outlets, limiting access to cold water near the bottom. The USGS is evaluating this event and other modeling scenarios for Detroit Dam.
Objectives:
- Understand why 2021 releases were warm despite early drawdown.
- Use modeling to explore how outlet use, lake level, and weather affect temperature outcomes.
- Identify optimal dam operations to support cold-water fish habitat.
- Extend modeling to other Willamette Valley Project dams such as Green Peter, Cougar, Lookout Point.
- Develop tools to help managers predict release temperatures in real time.
Media
Sources/Usage: Public Domain. View Media Details
Willamette Reservoir Mixed Outflow Temperature Estimator (ReMOTE)
ReMOTE is an Excel-based application developed to estimate vertical withdrawal zones and overall mixed-release water temperatures. It uses measured temperature profiles, water surface elevation, hypothetical release rates, and dam outlet characteristics. The formula is based on selective withdrawal methods from the CE-QUAL-W2 model. The application is meant to evaluate and guide water management decisions and provide insights on water temperature immediately downstream of Willamette Valley Project dams. Like all models, the application is subject to uncertainties in the data and inherent assumptions of the algorithms used and does not provide exact predictions.
Drawdown scenarios for Green Peter and Foster Dams
Green Peter and Foster Dams in the South Santiam River basin operate in tandem to regulate flows for flood-risk management and to generate hydropower. Both reservoirs provide recreation access and habitat. In 2023, Green Peter Lake underwent a deep drawdown to support downstream fish passage for juvenile salmon.
The USGS updated the temperature model for Green Peter and Foster Lakes to reflect 2023 conditions, including the deep drawdown in Green Peter Lake.
Objectives:
- Update model inputs to reflect current conditions.
- Updated weather and river data sources.
- Light penetration in the water was adjusted to reflect increased turbidity during the drawdown.
- Dam outlet settings were modified to better simulate how water was released.
- Precipitation and river inflow estimates were updated using new data sources.
- Model how the timing of drawdowns might affect water temperatures in the reservoirs and downstream in three scenarios:
- Base – Drawdown reaches target lake elevation by November 15.
- Dec01 – Drawdown starts later but reaches target by December 1.
- Dec15 – Drawdown starts even later, reaching target by December 15.
Model outcomes are tools to support planning and decision making, not exact predictions.
Media
Sources/Usage: Public Domain. View Media Details
Project pages related to water temperature modeling in the Willamette Valley
Water-quality monitoring during reservoir drawdowns
The USGS is monitoring water-quality above, within, and below Middle Fork Willamette and the South Santiam River dams using field-based and remote-sensing approaches to understand how reservoir drawdowns influence downstream water-quality conditions.
Photos taken at Willamette Valley Dams during field work
Green Peter Reservoir drawdown 2025
Green Peter Reservoir drawn down to a free-flowing stream channel winding through muddy sediment.
Green Peter Reservoir drawn down to a free-flowing stream channel winding through muddy sediment.
Detroit Dam spillway
Reservoir water gushes out of Detroit Dam outlets located midway up the spillway.
Reservoir water gushes out of Detroit Dam outlets located midway up the spillway.
Green Peter Dam
Water rushing down the top spillway at Green Peter Dam to join the Middle Santiam River.
Water rushing down the top spillway at Green Peter Dam to join the Middle Santiam River.