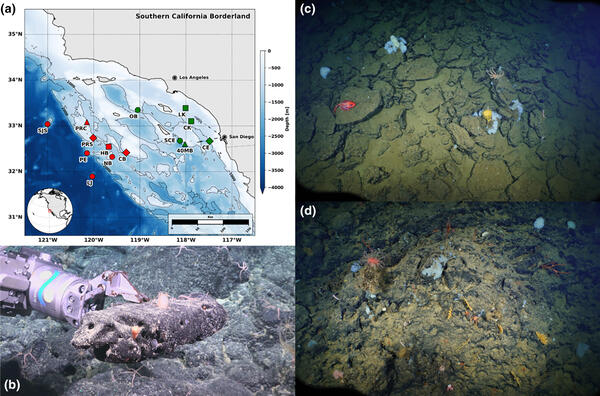
U.S. flag

An official website of the United States government

Images

Pacific Coastal and Marine Science Center images.

Filter Total Items: 1361
Close-up photo of pore water extraction from a surface marine sediment sample
Map of HI Abyssal Nodules Expedition study area

Map showing study area (outlined in yellow) of the Hawaii Abyssal Nodules and Associated Ecosystems Expedition.

Bathymetric map showing study area for the Hawaiʻi Abyssal Nodules and Associated Ecosystems Expedition
Hawaiʻi Abyssal Nodules and Associated Ecosystems Expedition study area
Map showing results of geomorphic change detection analysis of sediment volume differences between 2016 and 2017, Upper Carmel River
Results of geomorphic change detection analysis of sediment volume differences between 2016 and 2017, Upper Carmel River

Results of geomorphic change detection analysis of sediment volume differences between 2016 and 2017, Upper Carmel River, from the study Post-Fire Sediment Yield From a Central California Watershed: Field Measurements and Validation of the WEPP Model.

Photo of a post-fire debris flow depositing ash and sediment on a steep hillside
Post-fire debris flow, 2021 Dixie Fire in northern CA

Post-fire debris flow depositing ash and sediment on a steep hillside,  2021 Dixie Fire in northern CA.

Underwater footage of manganese nodules on seafloor
Cover image for Marine Minerals b-roll - Manganese Nodules

Underwater footage of manganese nodules on seafloor, taken from a remotely operated vehicle.

Underwater footage of marine phosphorites on seafloor
Cover image for Marine minerals b-roll - Marine Phosphorites

Underwater footage of marine phosphorites on seafloor, taken from a remotely operated vehicle.

Underwater footage of ferromanganese crust on seafloor, taken from a remotely operated vehicle
Cover image for Marine Minerals b-roll - Ferromanganese Crusts
Graph showing Pleistocene to Holocene chronology of the San Francisco (San Francisco) Bay region
Pleistocene to Holocene chronology of the San Francisco Bay region

Pleistocene to Holocene chronology of the San Francisco (San Francisco) Bay region highlighting sea level fluctuations and anthropogenic events.

Research Vessel Alaskan Gyre in Prince William Sound

Research Vessel Alaskan Gyre in Prince William Sound conducting Chirp and Sparker geophysical surveys to look for submarine landslide deposits, which are a major tsunami hazard in the fjord regions and also provide a record of large earthquake recurrence.

Research Vessel Alaskan Gyre in Prince William Sound conducting Chirp and Sparker geophysical surveys to look for submarine landslide deposits, which are a major tsunami hazard in the fjord regions and also provide a record of large earthquake recurrence.

Map showing where data have been collected along the Cascadia Subduction Zone
Updated Cascadia Subduction Zone fieldwork map

Updated in 2024, this index map of the U.S. Cascadia margin shows where data have been collected since 2018 as part of the Subduction Zone Marine Geohazards Project.

Updated in 2024, this index map of the U.S. Cascadia margin shows where data have been collected since 2018 as part of the Subduction Zone Marine Geohazards Project.

Was this page helpful?