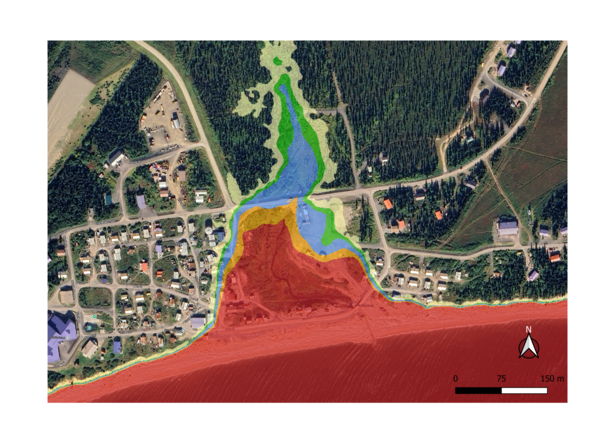
Maps of the study area and instrumentation in Faga'alu Bay
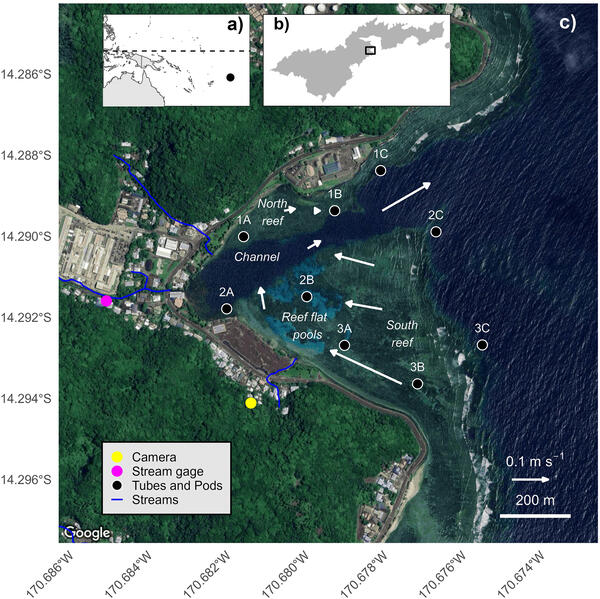
Maps of the study area and instrumentation in Faga'alu BayMaps of the study area and instrumentation in Faga'alu Bay. a) Location of American Samoa in the South Pacific region. b) Location of Faga'alu Bay on Tutuila Island, American Samoa. c) Faga'alu Bay, including locations of sediment pods and traps deployed at 9 locations. A time-lapse camera was installed at “Camera”.