
2018 USGS-NOAA multibeam bathymetry surveys
Multibeam bathymetric surveys conducted offshore of Oregon and northern California in 2018, a USGS-NOAA partnership

These surveys are part of the USGS project, “Cascadia Subduction Zone Marine Geohazards.”
Objectives
Fill in critical baseline bathymetric mapping gaps along the mid- to upper-slope (200 m to 1,500 m water depths)
Participants
USGS scientists Janet Watt (Principal Investigator, Fig. 4), Pete Dartnell, and Jamie Conrad
Partners
National Oceanic and Atmospheric Administration’s (NOAA) Office of Coast Survey (OCS), Expanding Pacific Research and Exploration of Submerged Systems (EXPRESS)
Platform Used
NOAA Ship Rainier (Fig. 1)
Data Collected
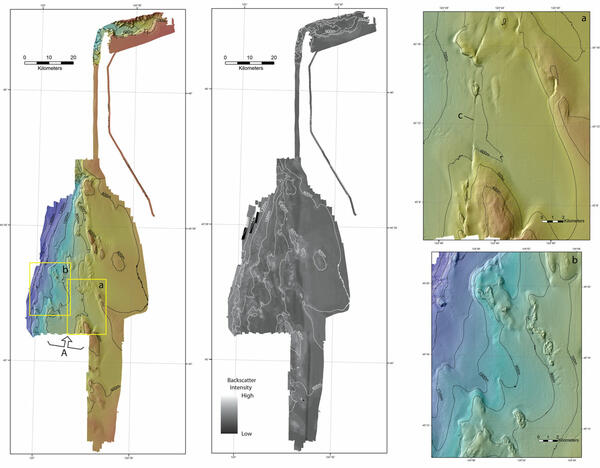
EM710 multibeam bathymetry, backscatter, water column data (Fig. 2)
Highlights
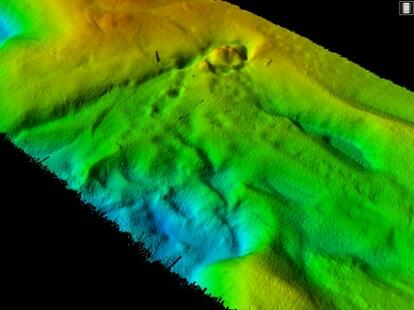
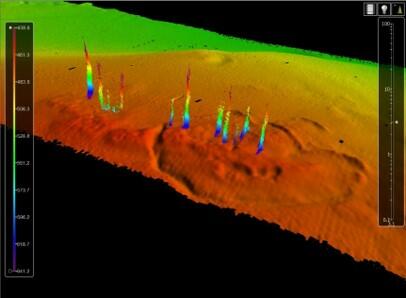
We imaged numerous interesting seafloor features, including active faults cutting the seafloor (Fig. 3), a possible mud volcano (Fig. 5), and a plethora of seafloor seeps (Fig. 6).
~ ~ ~ ~ ~ ~ ~ ~ ~ ~ ~ ~ ~ ~ ~ ~


~ ~ ~ ~ ~ ~ ~ ~ ~ ~ ~ ~ ~ ~ ~ ~

Multibeam bathymetric surveys conducted offshore of Oregon and northern California in 2018, a USGS-NOAA partnership
These surveys are part of the USGS project, “Cascadia Subduction Zone Marine Geohazards.”
Objectives
Fill in critical baseline bathymetric mapping gaps along the mid- to upper-slope (200 m to 1,500 m water depths)
Participants
USGS scientists Janet Watt (Principal Investigator, Fig. 4), Pete Dartnell, and Jamie Conrad
Partners
National Oceanic and Atmospheric Administration’s (NOAA) Office of Coast Survey (OCS), Expanding Pacific Research and Exploration of Submerged Systems (EXPRESS)
Platform Used
NOAA Ship Rainier (Fig. 1)
Data Collected
EM710 multibeam bathymetry, backscatter, water column data (Fig. 2)
Highlights
We imaged numerous interesting seafloor features, including active faults cutting the seafloor (Fig. 3), a possible mud volcano (Fig. 5), and a plethora of seafloor seeps (Fig. 6).
~ ~ ~ ~ ~ ~ ~ ~ ~ ~ ~ ~ ~ ~ ~ ~
~ ~ ~ ~ ~ ~ ~ ~ ~ ~ ~ ~ ~ ~ ~ ~