
Estimating Peak Streamflow Per Square Mile in Virginia’s Urban Basins
Understanding and anticipating high-flow and peak-flow conditions in Virginia streams is essential to human safety and sound management of our water resources and associated riparian and watershed ecosystems.
Methods and equations for estimating peak streamflow per square mile in Virginia’s urban basins
Overview
Meaningful characterizations of the magnitude and frequency of peak flows provide valuable insights into the dynamics and variability of water movement through Virginia's stream systems. Improved estimates of peak flows are helpful for management decisions including:
- Locating highways, industries, railroads, farms, and residences
- Designing and building bridges, dams, reservoirs, levees, floodwalls, and culverts
- Effectively managing the riparian systems and ecology associated with forested, agricultural, and urban landscapes.
Peak-flow estimates provide a basis for analysis of future streamflow response to changes in ecosystem and climate.
In urban areas, the ability to reliably predict peak flows can help inform urban planning and design, which in turn can help improve the management of urban basins. Understanding peak flows specific to urban basins and their relation to land-use changes over time allows managers to anticipate shifts in peak-flow magnitude and frequency. This knowledge can improve the design of hydraulic structures and the management of riparian systems and the ecology associated with urban landscapes. Urban peak-flow estimates also help managers predict how streamflow might respond to changes in ecosystem and climate.
Results
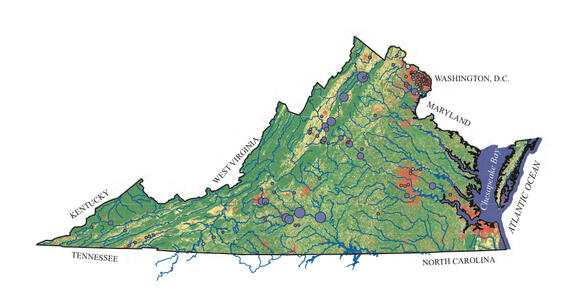
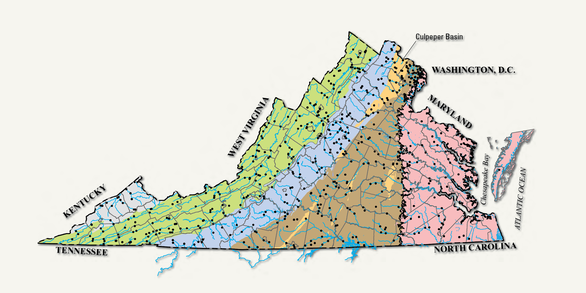
The U.S. Geological Survey, in cooperation with the Virginia Department of Transportation, performed a statistical analysis of peak-flow data collected in Virginia from 1895 through 2007, and then developed statistical models and equations to predict flow response in Virginia’s urban streams. Basin drainage area and basin percent urban area were used to identify and predict peak urban streamflow, which aids in the understanding of water flows and the environmental health of urban basins and their associated ecosystems.
These models can estimate Virginia urban peak flow for drainage basins from 1.2-2,400 square miles with 10-96% urban area. A total of 115 Virginia drainage basins were analyzed.
Understanding and anticipating high-flow and peak-flow conditions in Virginia streams is essential to human safety and sound management of our water resources and associated riparian and watershed ecosystems.
Methods and equations for estimating peak streamflow per square mile in Virginia’s urban basins
Overview
Meaningful characterizations of the magnitude and frequency of peak flows provide valuable insights into the dynamics and variability of water movement through Virginia's stream systems. Improved estimates of peak flows are helpful for management decisions including:
- Locating highways, industries, railroads, farms, and residences
- Designing and building bridges, dams, reservoirs, levees, floodwalls, and culverts
- Effectively managing the riparian systems and ecology associated with forested, agricultural, and urban landscapes.
Peak-flow estimates provide a basis for analysis of future streamflow response to changes in ecosystem and climate.
In urban areas, the ability to reliably predict peak flows can help inform urban planning and design, which in turn can help improve the management of urban basins. Understanding peak flows specific to urban basins and their relation to land-use changes over time allows managers to anticipate shifts in peak-flow magnitude and frequency. This knowledge can improve the design of hydraulic structures and the management of riparian systems and the ecology associated with urban landscapes. Urban peak-flow estimates also help managers predict how streamflow might respond to changes in ecosystem and climate.
Results
The U.S. Geological Survey, in cooperation with the Virginia Department of Transportation, performed a statistical analysis of peak-flow data collected in Virginia from 1895 through 2007, and then developed statistical models and equations to predict flow response in Virginia’s urban streams. Basin drainage area and basin percent urban area were used to identify and predict peak urban streamflow, which aids in the understanding of water flows and the environmental health of urban basins and their associated ecosystems.
These models can estimate Virginia urban peak flow for drainage basins from 1.2-2,400 square miles with 10-96% urban area. A total of 115 Virginia drainage basins were analyzed.