
By using the USGS- developed, GIS-based tool, we can automate the dasymetric mapping process. We have worked with various communities to create accurate population density maps to aid in risk and vulnerability analysis linked to natural hazards. By using the USGS- developed, GIS-based tool, we can automate the dasymetric mapping process. We have worked with various communities to create accurate population density maps to aid in risk and vulnerability analysis linked to natural hazards.

Problem: Human population distributions are commonly displayed using decennial census data. However, these data are aggregates of geographic units (census tracts or block groups) whose boundaries do not always reflect the natural distribution of human populations. A dasymetric mapping technique is one potential solution for mapping population density relative to residential land-use. Dasymetric mapping depicts quantitative areal data using boundaries that divide the area into zones of relative homogeneity with the purpose of better portraying the population distribution.
Future Work: With the automated tool, we have the ability to map and analyze any area of interest provided the appropriate data sources. We plan to update the tool to function in ArcGIS 10.
Time-Series Map of Population Distribution for Clackamas, County, Oregon: 1990-2007
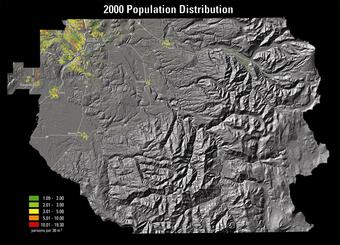

Illustrated below is a time series of residential development and habitation within Clackamas County, Oregon from 1990 to 2007. Population estimates and changes to population totals over the study period are depicted by 30 meter pixels overlain on a shaded relief background generated by a 10 meter digital elevation model. High accuracy/resolution data (street address file, 0.5m ortho-imagery) from the county, combined with NLCD and Census data greatly enhanced the ability to refine the depiction of inhabited areas.
By using the USGS- developed, GIS-based tool, we can automate the dasymetric mapping process. We have worked with various communities to create accurate population density maps to aid in risk and vulnerability analysis linked to natural hazards. By using the USGS- developed, GIS-based tool, we can automate the dasymetric mapping process. We have worked with various communities to create accurate population density maps to aid in risk and vulnerability analysis linked to natural hazards.
Problem: Human population distributions are commonly displayed using decennial census data. However, these data are aggregates of geographic units (census tracts or block groups) whose boundaries do not always reflect the natural distribution of human populations. A dasymetric mapping technique is one potential solution for mapping population density relative to residential land-use. Dasymetric mapping depicts quantitative areal data using boundaries that divide the area into zones of relative homogeneity with the purpose of better portraying the population distribution.
Future Work: With the automated tool, we have the ability to map and analyze any area of interest provided the appropriate data sources. We plan to update the tool to function in ArcGIS 10.
Time-Series Map of Population Distribution for Clackamas, County, Oregon: 1990-2007
Illustrated below is a time series of residential development and habitation within Clackamas County, Oregon from 1990 to 2007. Population estimates and changes to population totals over the study period are depicted by 30 meter pixels overlain on a shaded relief background generated by a 10 meter digital elevation model. High accuracy/resolution data (street address file, 0.5m ortho-imagery) from the county, combined with NLCD and Census data greatly enhanced the ability to refine the depiction of inhabited areas.