
Alabama Barrier Island Restoration Assessment Interactive Map
By Wetland and Aquatic Research Center
2019 (approx.)

Detailed Description
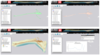
Figure 2: These four images illustrate how the web tool can visualize shoreline changes over time (top images), large bathymetry and lidar data (bottom left), or simple line charts illustrating water quality used in the feasibility planning decision process (bottom right).
Sources/Usage
Public Domain.
Related

Supporting Alabama Barrier Island Restoration Feasibility Study Through Online Data Tools
USGS WARC computer scientists designed, developed, and deployed a suite of web applications to assist the State of Alabama with restoration measure options of Dauphin Island.
Related
Supporting Alabama Barrier Island Restoration Feasibility Study Through Online Data Tools
USGS WARC computer scientists designed, developed, and deployed a suite of web applications to assist the State of Alabama with restoration measure options of Dauphin Island.