
Areas of potentially thick oil, Gulf Oil Spill 2010
Detailed Description
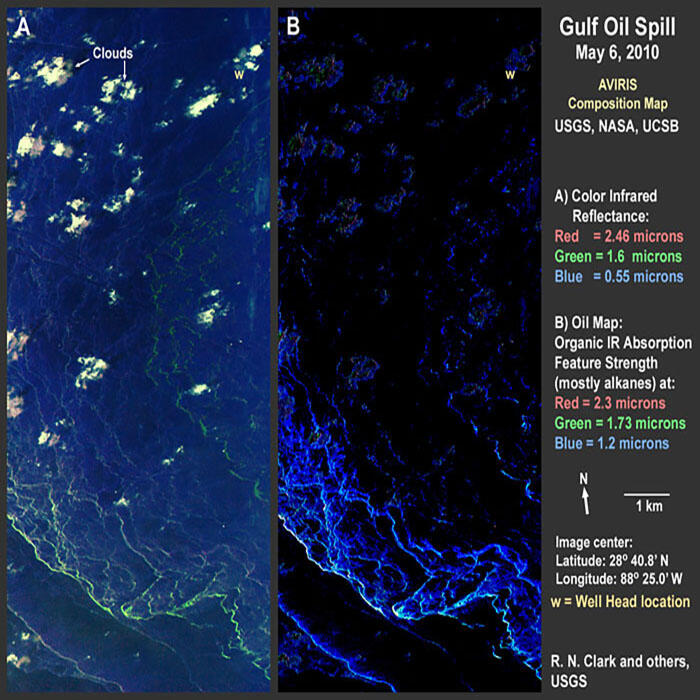
Color-composite imagery and derived three-point band-depth oil map illustrating areas of potentially thick oil. The images were produced using data from the Airborne Visible/Infrared Imaging Spectrometer (AVIRIS), flown aboard an ER–2 aircraft at 28,000 feet above sea level. AVIRIS measures a spectrum of the surface at each pixel from 0.35 to 2.5 microns (the visible spectrum is: blue: 0.4 microns, green 0.53 microns, deep red 0.7 microns) in 224 wavelengths. This fine spectral sampling allows discrimination of absorptions due to specific compounds in the scene.
Sources/Usage
Public Domain.
A Method for Qualitative Mapping of Thick Oil Spills Using Imaging Spectroscopy
USGS Open-File Report 2010-1101