
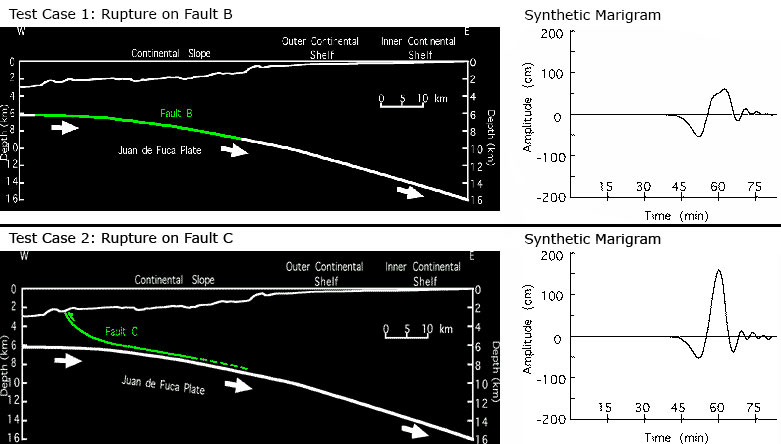
Depth of rupture, two scenarios

Detailed Description
The upper left plot shows the portion of a fault that ruptures in green. The local tsunami that is generated from this rupture is shown as a synthetic marigram (wave amplitude as a function of time). Fault C, shown in the lower left plot, ruptures much shallower in the earth and generates a substantially larger tsunami as shown in its accompanying marigram.
Sources/Usage
Public Domain.