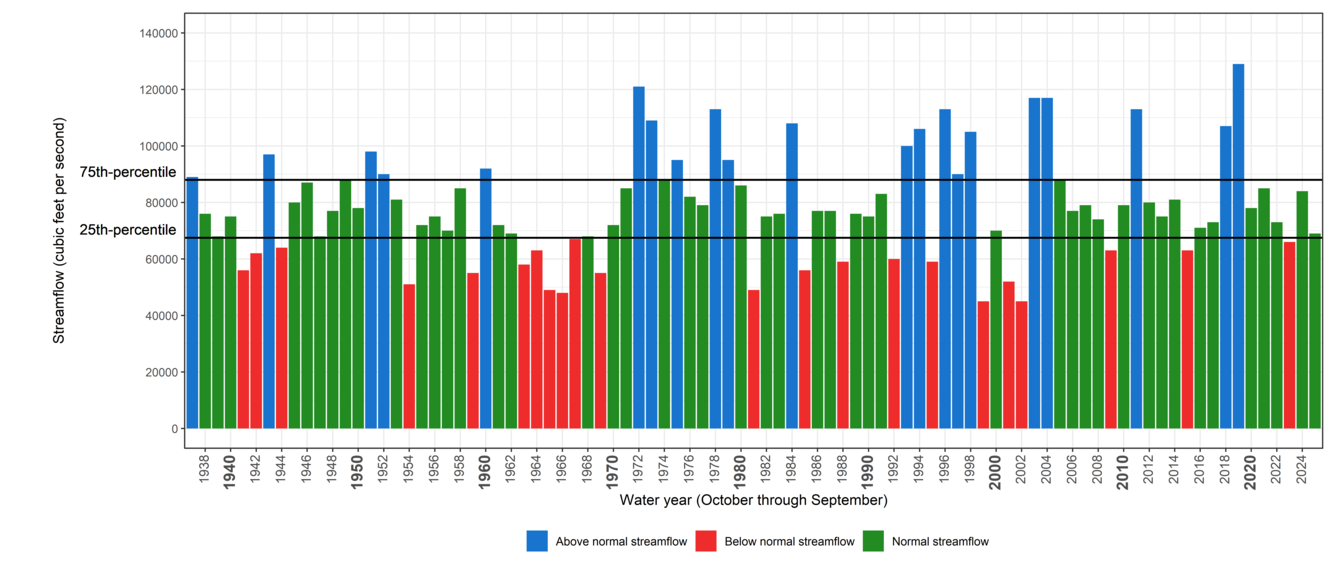
Estimated annual-mean streamflow entering the Chesapeake Bay

Detailed Description
Figure 4: Estimated annual-mean streamflow entering the Chesapeake Bay. Normal streamflow values, falling between the 25th and 75th percentiles of period-of-record annual-mean streamflow values are shown as green bars. Blue bars represent above normal streamflow values. Red bars represent below normal streamflow values.
Sources/Usage
Public Domain.


