
Chesapeake Bay Streamflow Statistics by Month and Year
Explore resources here describing estimates of freshwater flow entering Chesapeake Bay.
The health of the Chesapeake Bay is greatly affected by freshwater flow from rivers draining its watershed. The amount of freshwater flow (also called streamflow) will:
• Change salinity levels in the Bay, which affect oysters, crabs, and finfish.
• Influence the amounts of nutrients, sediment, and contaminants delivered to tidal waters, which affects fisheries and submerged aquatic vegetation.
The USGS provides estimates of the monthly and annual amounts of freshwater flow into the Bay so scientists and managers can better understand effects on ecosystem conditions.
Monthly Mean Streamflow Over The Past 2 Years
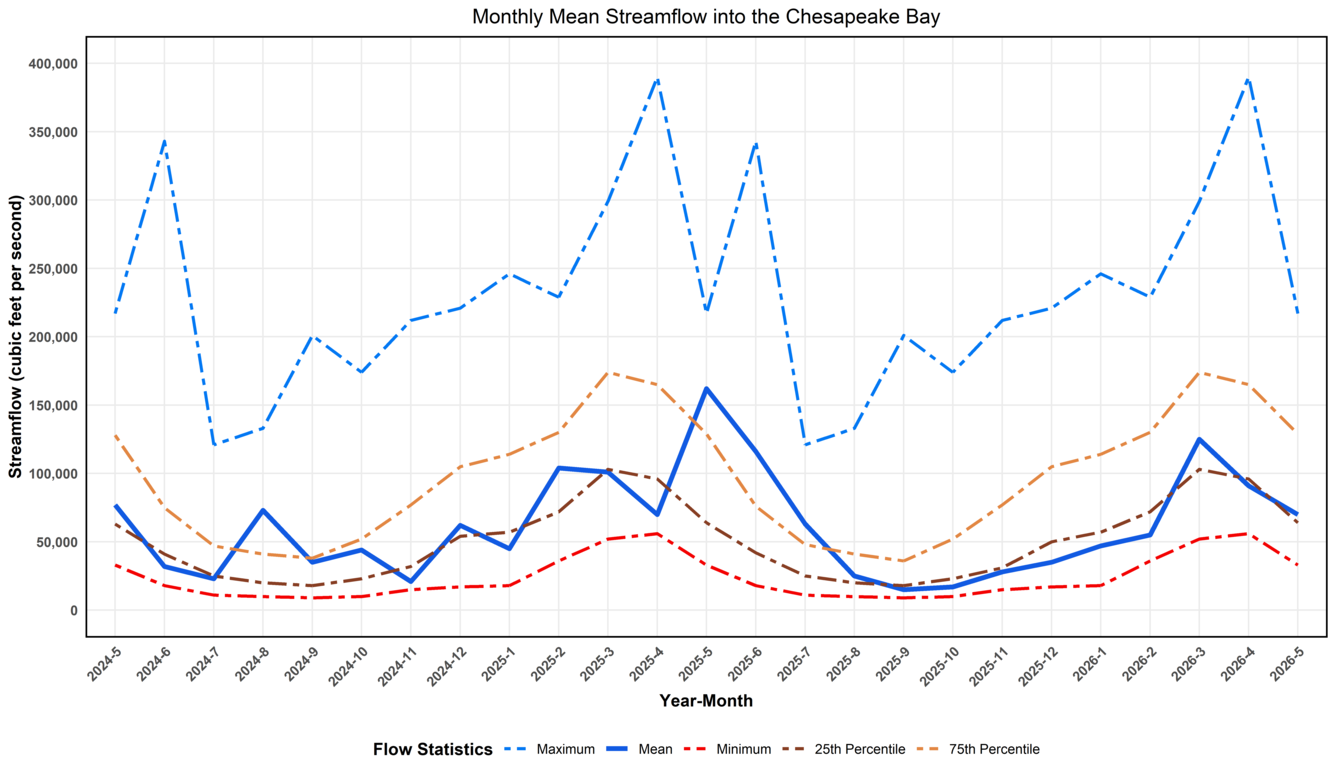
Most recent estimated monthly mean streamflow entering Chesapeake Bay for May 2026 was 70,200 cubic feet per second. This value, (Figure 1, mean), which is provisional and subject to revision, is considered to be within the normal range of May streamflow. Normal streamflow entering the Bay in May is between 63,700 cubic feet per second (Figure 1, 25-percentile) and 128,500 cubic feet per second (Figure 1, 75-percentile), of all May streamflow values over an 89-year period of record.
Annual Mean Streamflow into the Chesapeake Bay
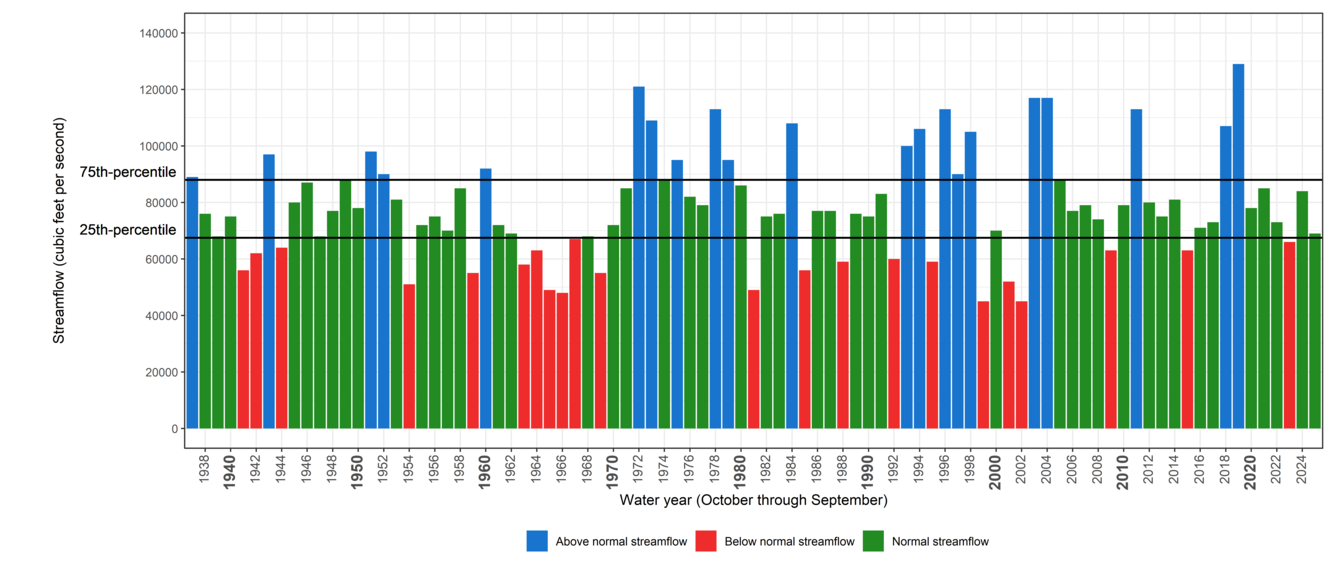
The estimated annual-mean streamflow entering the Chesapeake Bay over the period of record has been calculated for each of the complete water years in the period of record, beginning in 1937 as shown in Figure 2. For the most recent complete water year (2025), this value was 69,000 cubic feet per second. Normal annual-mean streamflow is between 67,250 cubic feet per second and 88,750 cubic feet per second — the 25th and 75th percentiles of all annual-mean values, respectively. Of the most recent ten complete water years, seven were normal, two were above normal, and one was below normal.
Streamflow By Major Watershed

The Amount of Freshwater from Different Watersheds: The majority of freshwater flow enters the Bay from three major watersheds: Susquehanna, Potomac, and James (Figure 3). These three watersheds, and the remaining areas, are represented by five streamflow cross sections across the Bay (A through E; Figure 3). The amount of freshwater flow from these areas is estimated each month (figure 4).
In May 2026, the largest proportion of streamflow entered at Section A, accounting for about 63 percent of total streamflow entering the Bay. This information, along with proportional flow in recent months, is shown in Figure 4.
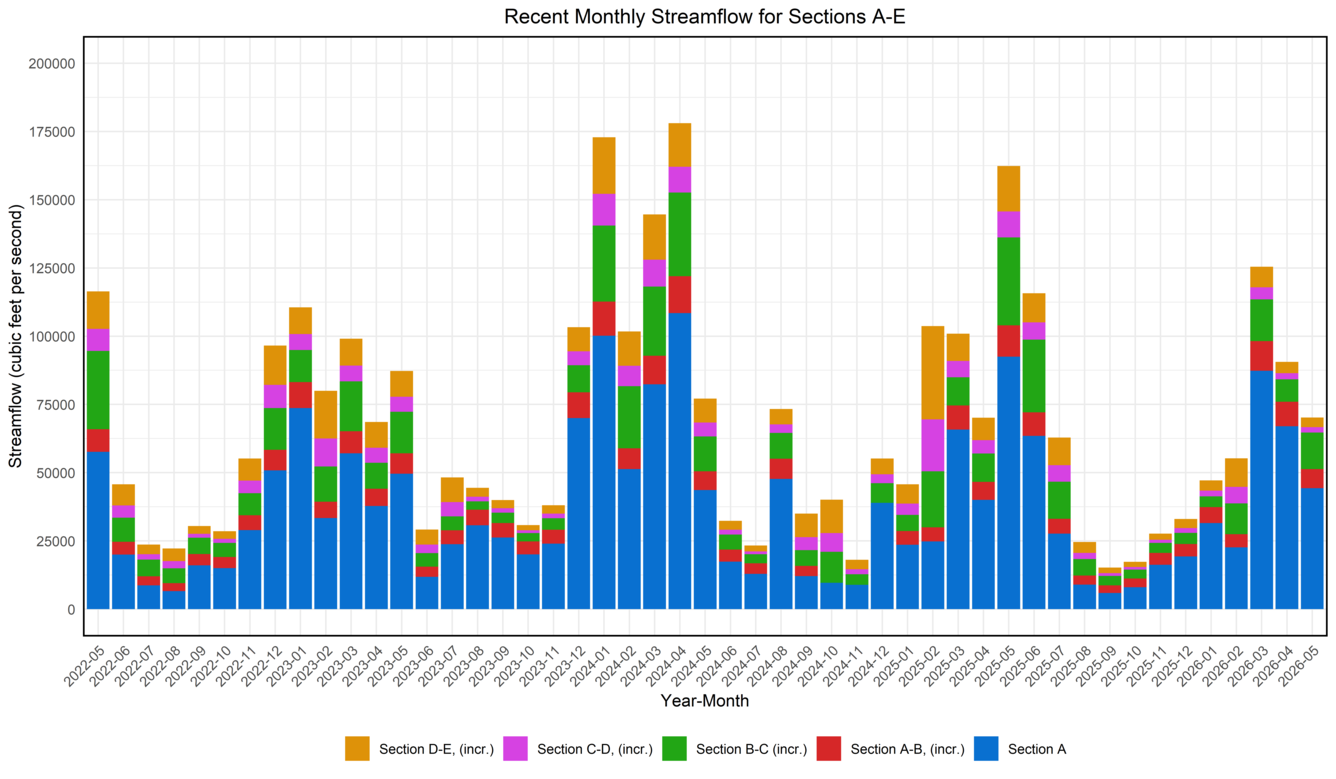
Estimated monthly mean streamflow entering Chesapeake Bay, shown proportionally by cross sections A through E. Water passing section A is largely from the Susquehanna River watershed; water entering between sections B and C is largely from the Potomac River watershed; and water entering between sections D and E is largely from the James River watershed.
Below are resources describing Chesapeake Bay streamflow estimation methods, the history of programming the Chesapeake Bay Streamflow interactive website, and other science projects and research associated with Chesapeake Bay estimated streamflow, such as work characterizing Chesapeake Bay Water-Quality Loads and Trends.

Chesapeake Bay Estimated Streamflow: METHODS
Chesapeake Bay Real-Time Streamflow Map
Chesapeake Bay Estimated Streamflow: METHODS
Chesapeake Bay Estimated Streamflow: WEBSITE HISTORY

Chesapeake Bay Water-Quality Loads and Trends
Explore resources here describing estimates of freshwater flow entering Chesapeake Bay.
The health of the Chesapeake Bay is greatly affected by freshwater flow from rivers draining its watershed. The amount of freshwater flow (also called streamflow) will:
• Change salinity levels in the Bay, which affect oysters, crabs, and finfish.
• Influence the amounts of nutrients, sediment, and contaminants delivered to tidal waters, which affects fisheries and submerged aquatic vegetation.
The USGS provides estimates of the monthly and annual amounts of freshwater flow into the Bay so scientists and managers can better understand effects on ecosystem conditions.
Monthly Mean Streamflow Over The Past 2 Years
Most recent estimated monthly mean streamflow entering Chesapeake Bay for May 2026 was 70,200 cubic feet per second. This value, (Figure 1, mean), which is provisional and subject to revision, is considered to be within the normal range of May streamflow. Normal streamflow entering the Bay in May is between 63,700 cubic feet per second (Figure 1, 25-percentile) and 128,500 cubic feet per second (Figure 1, 75-percentile), of all May streamflow values over an 89-year period of record.
Annual Mean Streamflow into the Chesapeake Bay
The estimated annual-mean streamflow entering the Chesapeake Bay over the period of record has been calculated for each of the complete water years in the period of record, beginning in 1937 as shown in Figure 2. For the most recent complete water year (2025), this value was 69,000 cubic feet per second. Normal annual-mean streamflow is between 67,250 cubic feet per second and 88,750 cubic feet per second — the 25th and 75th percentiles of all annual-mean values, respectively. Of the most recent ten complete water years, seven were normal, two were above normal, and one was below normal.
Streamflow By Major Watershed
The Amount of Freshwater from Different Watersheds: The majority of freshwater flow enters the Bay from three major watersheds: Susquehanna, Potomac, and James (Figure 3). These three watersheds, and the remaining areas, are represented by five streamflow cross sections across the Bay (A through E; Figure 3). The amount of freshwater flow from these areas is estimated each month (figure 4).
In May 2026, the largest proportion of streamflow entered at Section A, accounting for about 63 percent of total streamflow entering the Bay. This information, along with proportional flow in recent months, is shown in Figure 4.
Estimated monthly mean streamflow entering Chesapeake Bay, shown proportionally by cross sections A through E. Water passing section A is largely from the Susquehanna River watershed; water entering between sections B and C is largely from the Potomac River watershed; and water entering between sections D and E is largely from the James River watershed.
Below are resources describing Chesapeake Bay streamflow estimation methods, the history of programming the Chesapeake Bay Streamflow interactive website, and other science projects and research associated with Chesapeake Bay estimated streamflow, such as work characterizing Chesapeake Bay Water-Quality Loads and Trends.
Chesapeake Bay Estimated Streamflow: METHODS
Chesapeake Bay Real-Time Streamflow Map
Chesapeake Bay Estimated Streamflow: METHODS
Chesapeake Bay Estimated Streamflow: WEBSITE HISTORY