
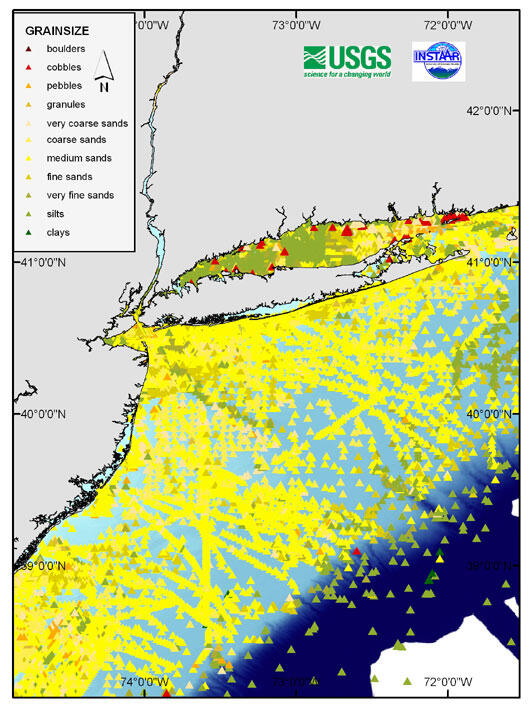
Example of grain size plot from usSEABED
Detailed Description
Map showing variations in grain size in the New York Bight using textural data from usSEABED. Individual data points are represented as colored triangles. Each color corresponds to a different grain size class as described in the legend.
Sources/Usage
Public Domain.