
Figure 1. Plot depicting power to detect a trend of -4% per year over

Detailed Description
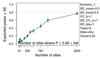
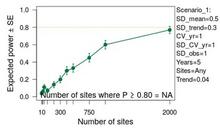
Figure 1. Plot depicting power to detect a trend of -4% per year over 5 years at various sample sizes.
Sources/Usage
Public Domain.
Related

TrendPowerTool: A web lookup tool for estimating the statistical power of a monitoring program to detect population trends
A simulation-based power analysis can be used to estimate the sample sizes needed for a successful monitoring program, but requires technical expertise and sometimes extensive computing resources. We developed a web-based lookup app, called TrendPowerTool, to provide guidance for ecological monitoring programs when resources are not available for a simulation-based power analysis (Fig. 1)...
Related
TrendPowerTool: A web lookup tool for estimating the statistical power of a monitoring program to detect population trends
A simulation-based power analysis can be used to estimate the sample sizes needed for a successful monitoring program, but requires technical expertise and sometimes extensive computing resources. We developed a web-based lookup app, called TrendPowerTool, to provide guidance for ecological monitoring programs when resources are not available for a simulation-based power analysis (Fig. 1)...