
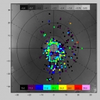
Geometric distribution of cold spots overlaid on the MOLA DEM
By Astrogeology Science Center
1997 (approx.)

Detailed Description
Geometric distribution of cold spots overlaid on the MOLA DEM. The cold spots are colored relative to T18-T25. The strongest cold spots are either located on the sides of the perennial polar cap or near craters. 10° latitude lines and 30° longitude lines are marked. The central 8 degrees of the geometric pole were not viewed from the MGS orbit.
Sources/Usage
Public Domain.
Related

Related