
Map of study area and examples of the model domains
Detailed Description
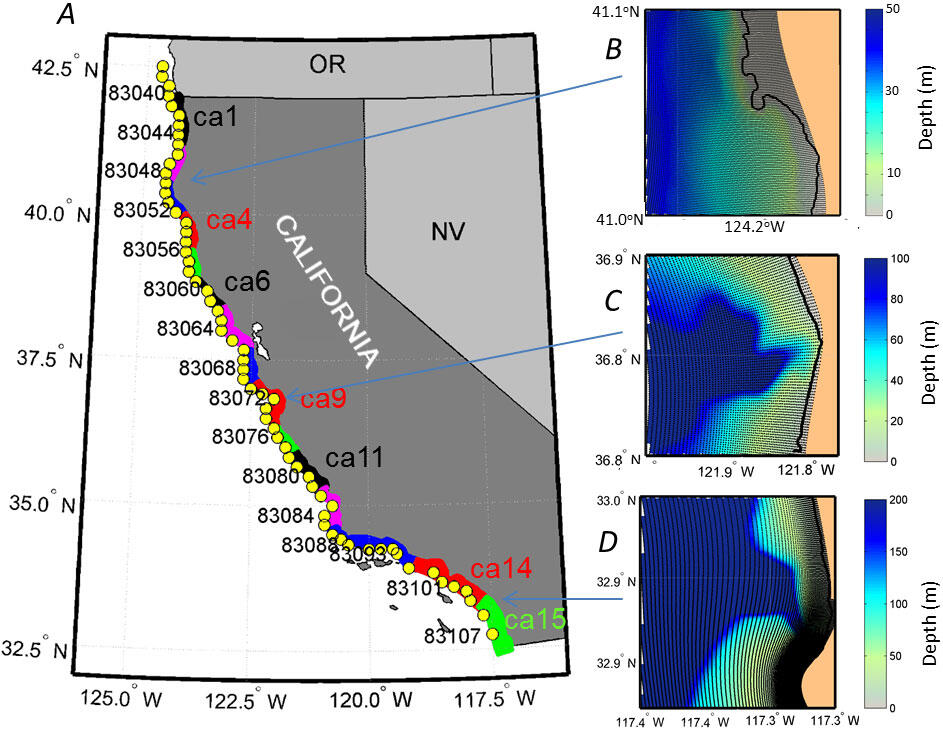
(A) Map of 15 SWAN grids along the California coast used in the study. Yellow dots denote the location of WIS boundary points used in the model simulations; station IDs are shown for every fourth boundary point. Example close-up views of the grids and bathymetry in the vicinity of (B) Trinidad, (C) Monterey Canyon, and (D) La Jolla Canyon display the great bathymetric and topographic variability that results in large spatial gradients of wave energy along California.
Sources/Usage
Public Domain.
USGS data release
Wave Model Data for the California Continental Shelf