
Maps of alternative site-response explanatory variables:
Detailed Description
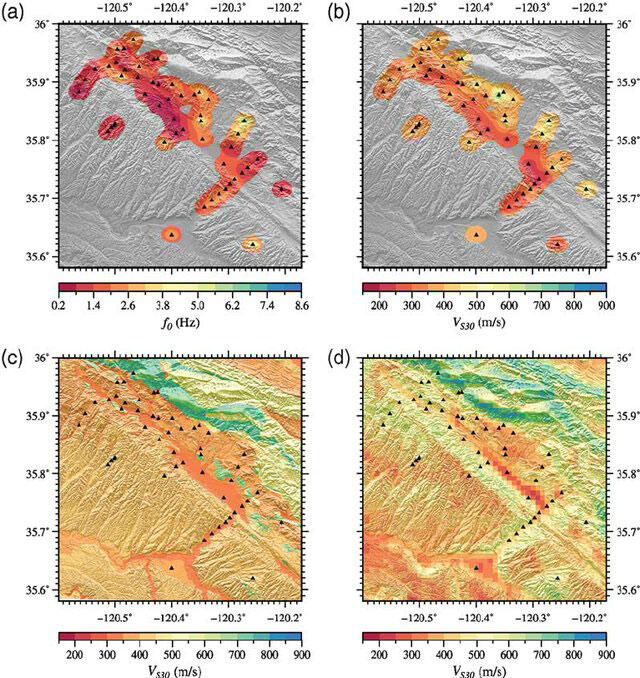
Maps of alternative site-response explanatory variables: (a) the dominant frequency f0 (Zhao et al., 2006), (b) VS30 estimated from SASW measurements (Thompson, Kayen, et al., 2010), (c) VS30 estimated from surficial geology (Wills and Clahan, 2006), and (d) VS30 estimated from topographic slope (Wald and Allen, 2007; Allen and Wald, 2009).
Sources/Usage
Public Domain.
Multiscale Site-Response Mapping: A Case Study of Parkfield, California
Thompson, E.M., Baise, L.G., Kayen, R.E., Morgan, E.C., and Kaklamanos, J., 2011, Multiscale Site-Response Mapping: A Case Study of Parkfield, California: Bulletin of the Seismological Society of America, v. 101 no. 3, pp. 1081–1100, URL: https://doi.org/10.1785/0120100211.