
Posterior summary statistics from the SCR model
Detailed Description
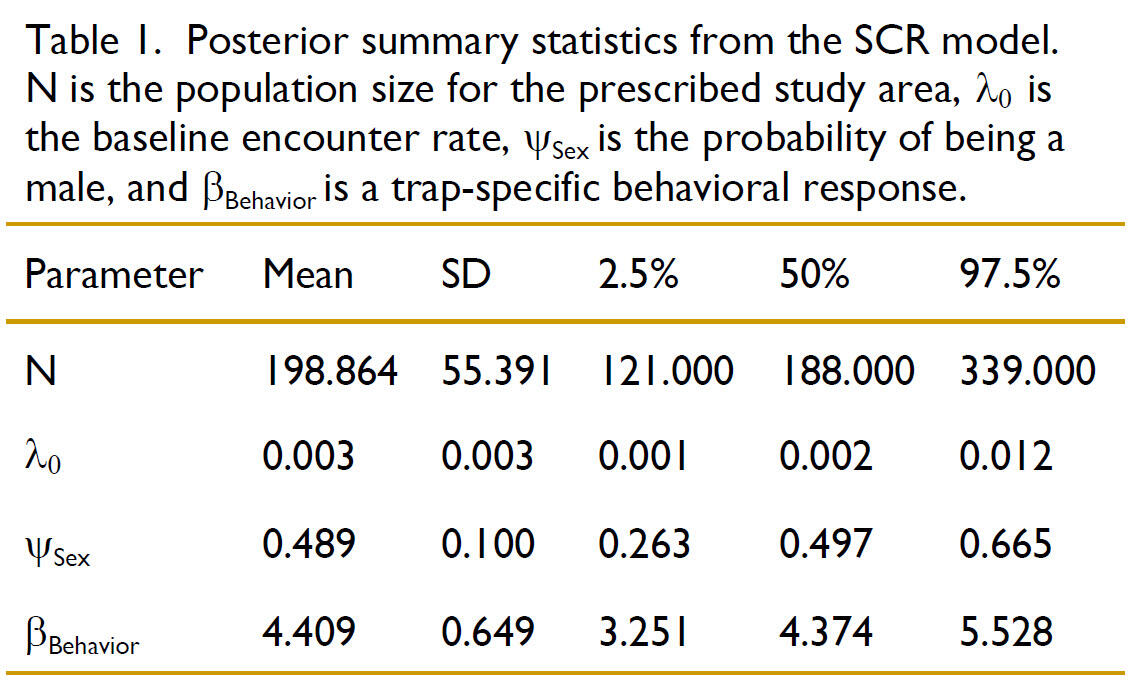
Table 1. Posterior summary statistics from the SCR model. N is the population size for the prescribed study area, is the baseline encounter rate, Sex is the probability of being a male, and Behavior is a trap-specific behavioral response.