
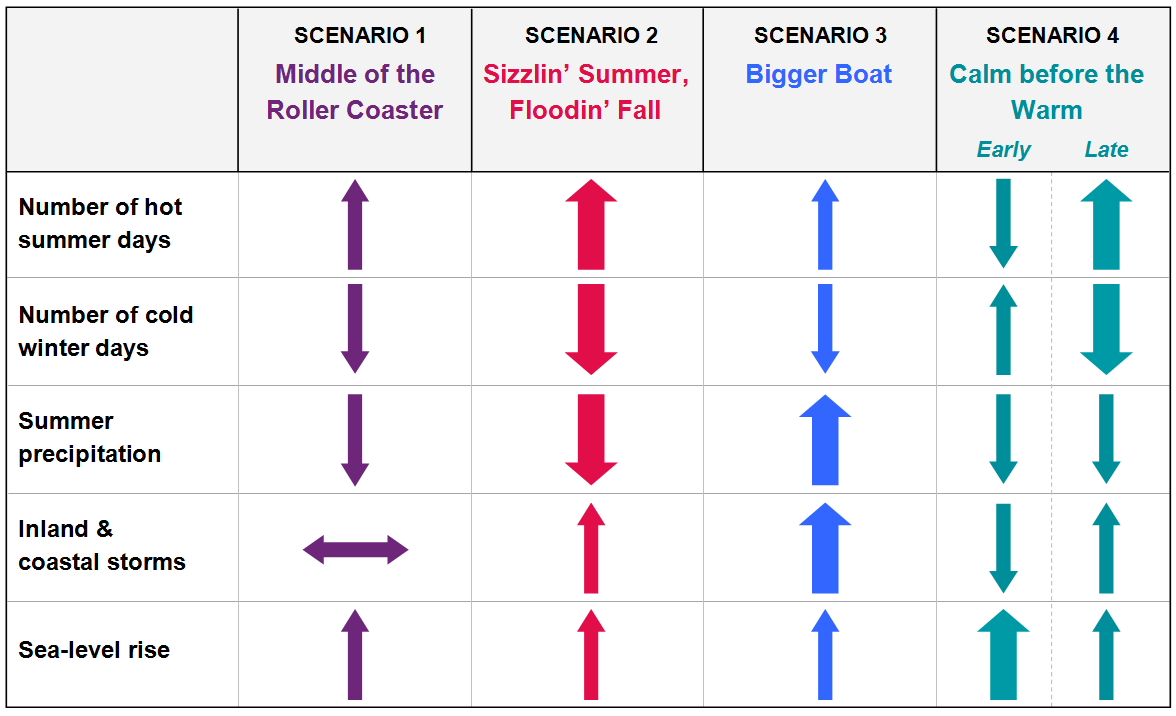
Projected changes in key climate variables for Acadia National Park
Detailed Description
Projected changes in key variables over the next 25 years for each Acadia climate scenario. Up arrows denote increasing trends, down arrows decreasing trends and sideways arrows indicate no change. Arrow size denotes amount of change. Scenario 1 is split into ‘early’ and ‘late’ phases of the scenario. Comparisons are made to conditions from 1993-2013. Modified from Star et al. (2016).