
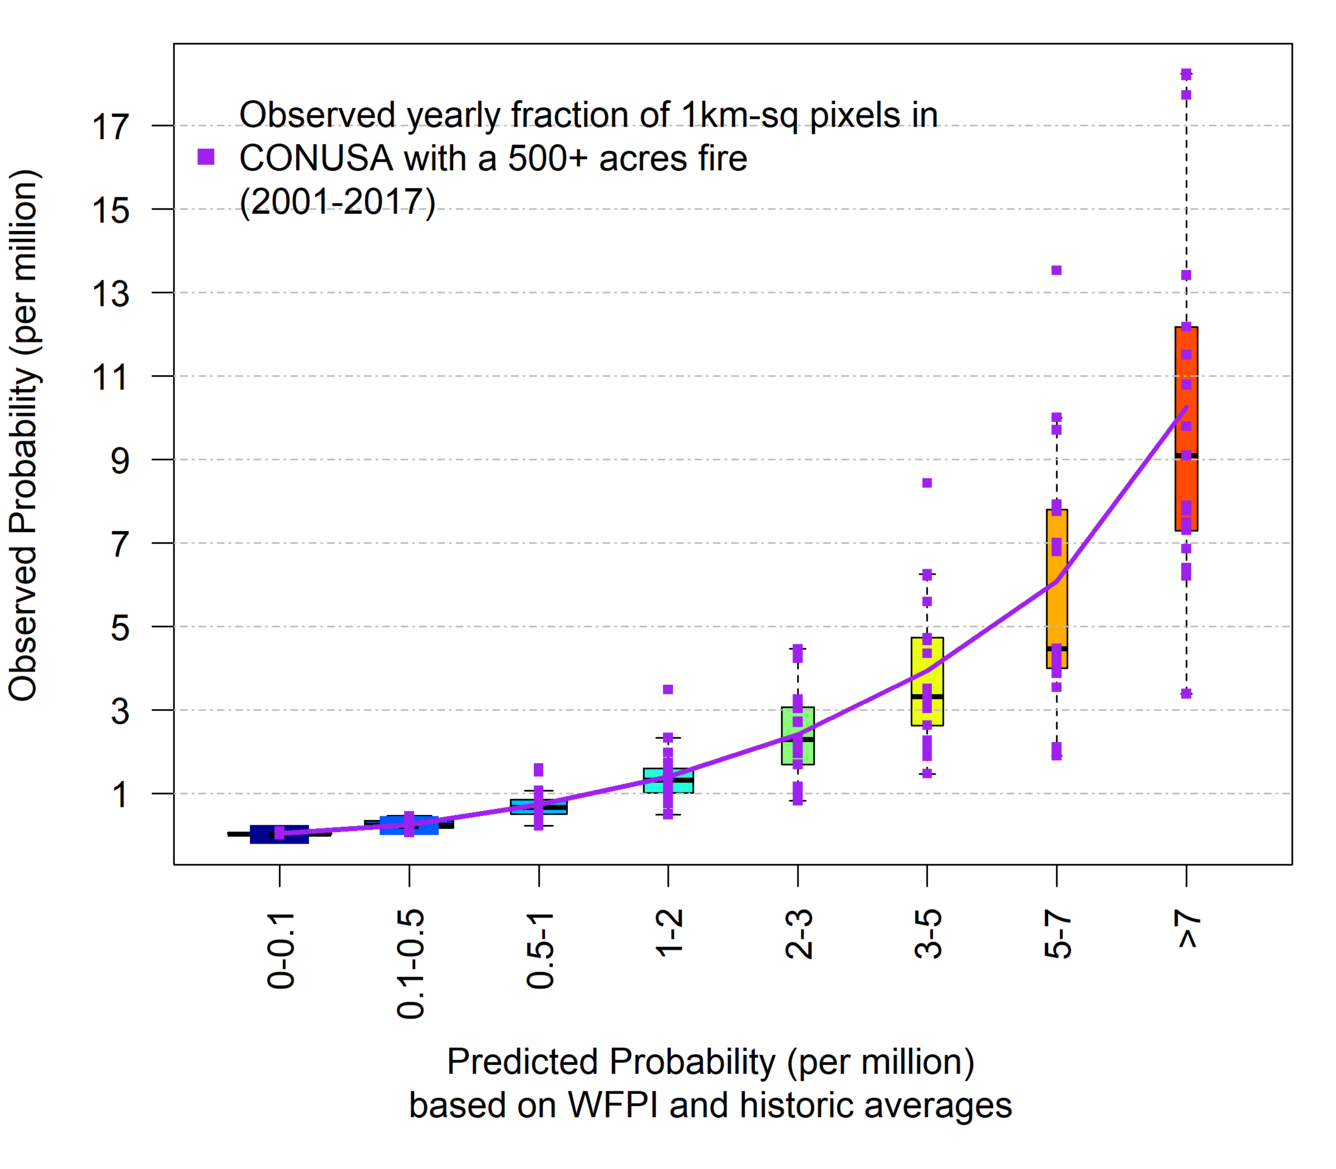
Reliability diagram for the WLFP model
Detailed Description
Reliability diagram for the WLFP model. On average the risk of a large fire event was observed to be ~9 times greater when the predicted risk was extreme (risk category red; predicted class >7) than when the predicted risk was moderate (risk category turquoise; predicted class 1-2). Between year variability is demonstrated by the length of the boxes and the extended whiskers.
Sources/Usage
Public Domain.